Dashboard
High Debt Company with a Debt to Equity ratio (avg) at 3.36 times
- Poor long term growth as Net Sales has grown by an annual rate of 14.16% over the last 5 years
- High Debt Company with a Debt to Equity ratio (avg) at 3.36 times
Healthy long term growth as Operating profit has grown by an annual rate 107.56%
The company has declared Positive results for the last 3 consecutive quarters
Stock is technically in a Bullish range
With ROCE of 33.3, it has a Fair valuation with a 5.2 Enterprise value to Capital Employed
Stock DNA
Pharmaceuticals & Biotechnology
INR 915 Cr (Micro Cap)
22.00
34
0.00%
2.77
72.53%
15.68
Total Returns (Price + Dividend) 
Latest dividend: 1 per share ex-dividend date: Jul-29-2010
Risk Adjusted Returns v/s
Returns Beta

News
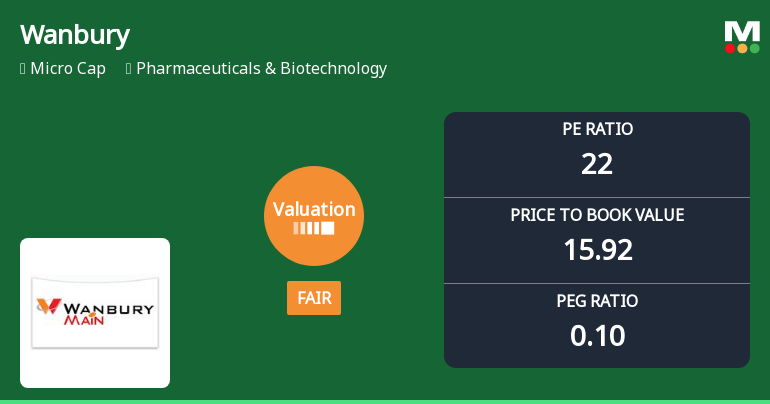
Wanbury Ltd Valuation Shifts to Fair Amid Strong Fundamentals and Market Outperformance
Wanbury Ltd, a micro-cap player in the Pharmaceuticals & Biotechnology sector, has seen a notable shift in its valuation parameters, moving from an attractive to a fair rating. This change comes amid a backdrop of strong operational metrics and a mixed valuation landscape within its peer group, prompting investors to reassess the stock’s price attractiveness relative to historical and sector benchmarks.
Read More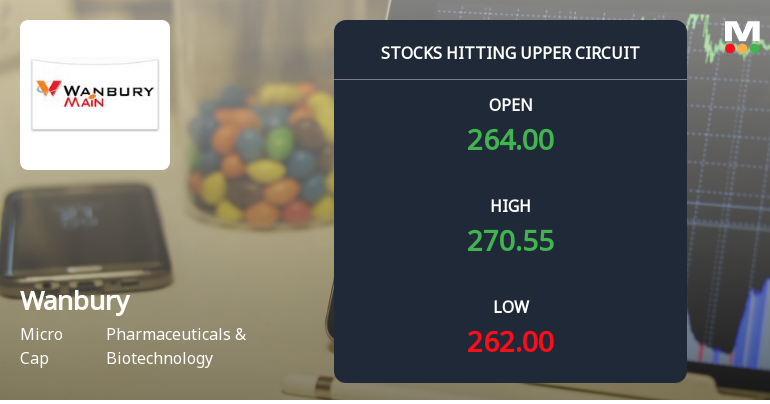
Wanbury Ltd Locks at Upper Circuit With 5% Gain — Buyers Queue, Sellers Absent
At Rs 271, the buying was done — not because demand dried up, but because the exchange wouldn't let the stock go any higher. Wanbury Ltd locked at its upper circuit of 5% on 20 May 2026, with buyers queuing and no sellers willing to part with shares.
Read More
Wanbury Ltd Technical Momentum Shifts Signal Bullish Outlook Amid Micro-Cap Surge
Wanbury Ltd, a micro-cap player in the Pharmaceuticals & Biotechnology sector, has exhibited a notable shift in its technical momentum, upgrading its outlook from mildly bullish to bullish. This change is underscored by a combination of positive signals from key technical indicators including MACD, Bollinger Bands, and moving averages, suggesting renewed investor interest and potential upside in the near term.
Read More Announcements
Announcement under Regulation 30 (LODR)-Press Release / Media Release
10-Jun-2026 | Source : BSEPress Release on Quality inspection by the Therapeutic Goods Administration (TGA) at Tanuku Andhra Pradesh
Announcement under Regulation 30 (LODR)-Press Release / Media Release
09-Jun-2026 | Source : BSEPress Release on Launch of New APIs.
Announcement under Regulation 30 (LODR)-Press Release / Media Release
02-Jun-2026 | Source : BSEPress Release on Q4 & Year ended FY 2026 for Audited Financial Results
Corporate Actions

No Upcoming Board Meetings

Wanbury Ltd has declared 10% dividend, ex-date: 29 Jul 10

No Splits history available

No Bonus history available

No Rights history available
Quality key factors
Valuation key factors
Technicals key factors
 Technical Indicator Scale: Bearish, Mildly Bearish, Sideways, Mildly Bullish, Bullish Turned
 Shareholding Snapshot : Mar 2026
Shareholding Compare (%holding)
Non Institution
86.6929
Held by 4 Schemes (0.0%)
Held by 4 FIIs (0.59%)
Expert Chemicals (india) Pvt Ltd (34.36%)
Suresh Bhatia (3.11%)
42.17%
Quarterly Results Snapshot (Standalone) - Mar'26 - QoQ

QoQ Growth in quarter ended Mar 2026 is 1.31% vs 1.49% in Dec 2025

QoQ Growth in quarter ended Mar 2026 is 37.69% vs 3.82% in Dec 2025
Half Yearly Results Snapshot (Standalone) - Sep'25
Growth in half year ended Sep 2025 is 10.59% vs 0.53% in Sep 2024
Growth in half year ended Sep 2025 is 216.45% vs -24.81% in Sep 2024
Nine Monthly Results Snapshot (Standalone) - Dec'25
YoY Growth in nine months ended Dec 2025 is 14.08% vs -2.41% in Dec 2024
YoY Growth in nine months ended Dec 2025 is 332.20% vs -53.94% in Dec 2024
Annual Results Snapshot (Standalone) - Mar'26
YoY Growth in year ended Mar 2026 is 8.47% vs 4.14% in Mar 2025
YoY Growth in year ended Mar 2026 is 116.61% vs 0.43% in Mar 2025
About Wanbury Ltd


