Stock DNA
Other Consumer Services
INR 20,056 Cr ()
NA (Loss Making)
32
0.00%
0.00
0.00%
9.35
Total Returns (Price + Dividend) 
Urban Company for the last several years.
Risk Adjusted Returns v/s
Returns Beta

News
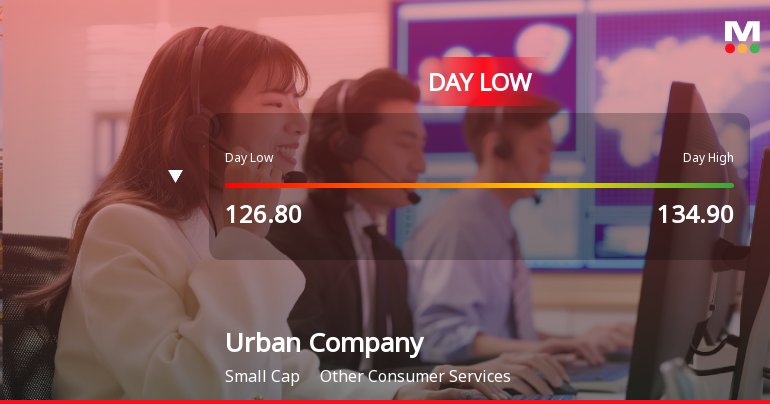
Urban Company Ltd Hits Intraday Low Amid Price Pressure on 11 May 2026
Urban Company Ltd experienced a notable decline today, touching an intraday low of Rs 128.4, reflecting a sharp price pressure of -7.99% as the stock underperformed its sector and broader market indices amid a generally bearish market sentiment.
Read More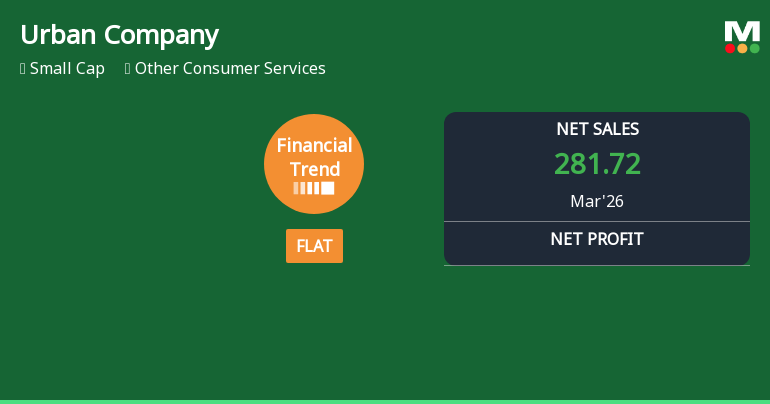
Urban Company Ltd Reports Flat Quarterly Performance Amid Margin Pressures
Urban Company Ltd, a key player in the Other Consumer Services sector, posted a flat financial performance for the quarter ended March 2026, signalling a pause in its recent downward trend. Despite achieving its highest quarterly net sales to date, the company continues to grapple with significant margin contraction and losses, reflecting ongoing operational challenges.
Read MoreAre Urban Company Ltd latest results good or bad?
Urban Company Ltd's latest financial results for Q4 FY26 reveal a complex picture characterized by significant revenue growth alongside substantial operational challenges. The company reported net sales of ₹425.56 crores, reflecting a year-on-year growth of 42.59% and a sequential increase of 11.21%. However, this revenue expansion has not translated into profitability, as the company faced a net loss of ₹161.16 crores, marking a notable deterioration from the previous quarter's loss of ₹21.26 crores. The operating margin for Q4 FY26 plummeted to -26.89%, the lowest in eight quarters, indicating serious issues with cost management and operational efficiency. This decline is particularly concerning given that employee costs surged by 40.13% year-on-year, outpacing revenue growth and suggesting difficulties in achieving operational leverage. The company's operating profit before depreciation, interest, and t...
Read More Announcements
Announcement under Regulation 30 (LODR)-Newspaper Publication
06-Jun-2026 | Source : BSENewspaper Publication of 12th Annual General Meeting Notice and Annual Report for FY 25-26
Reg. 34 (1) Annual Report.
05-Jun-2026 | Source : BSENotice of 12th Annual General Meeting of the Members of the Company and Annual Report for the financial year 2025-26
Notice Of 12Th Annual General Meeting Of The Members Of The Company And Annual Report For The Financial Year 2025-26
05-Jun-2026 | Source : BSENotice of 12th Annual General Meeting of the Members of the Company and Annual Report for the Financial year 2025-26
Corporate Actions

No Upcoming Board Meetings

No Dividend history available

No Splits history available

No Bonus history available

No Rights history available
Quality key factors
Valuation key factors
Technicals key factors
 Technical Indicator Scale: Bearish, Mildly Bearish, Sideways, Mildly Bullish, Bullish Turned
 Shareholding Snapshot : Mar 2026
Shareholding Compare (%holding)
FIIs
None
Held by 16 Schemes (8.88%)
Held by 50 FIIs (55.87%)
Varun Khaitan (6.34%)
Elevation Capital V Limited (8.13%)
6.84%
Quarterly Results Snapshot (Standalone) - Mar'26 - QoQ

QoQ Growth in quarter ended Mar 2026 is 7.82% vs -3.11% in Dec 2025

QoQ Growth in quarter ended Mar 2026 is -914.59% vs 68.86% in Dec 2025
Annual Results Snapshot (Standalone) - Mar'26
YoY Growth in year ended Mar 2026 is 38.16% vs 36.87% in Mar 2025
YoY Growth in year ended Mar 2026 is -167.36% vs 2,691.78% in Mar 2025


