Dashboard
Low ability to service debt as the company has a high Debt to EBITDA ratio of 4.24 times
- Low ability to service debt as the company has a high Debt to EBITDA ratio of 4.24 times
- The company has been able to generate a Return on Equity (avg) of 9.60% signifying low profitability per unit of shareholders funds
With a growth in Net Profit of 169.85%, the company declared Very Positive results in Dec 25
Stock is technically in a Mildly Bearish range
With ROCE of 13, it has a Very Attractive valuation with a 1.1 Enterprise value to Capital Employed
Stock DNA
Gems, Jewellery And Watches
INR 1,265 Cr (Small Cap)
6.00
48
1.14%
1.05
13.42%
1.54
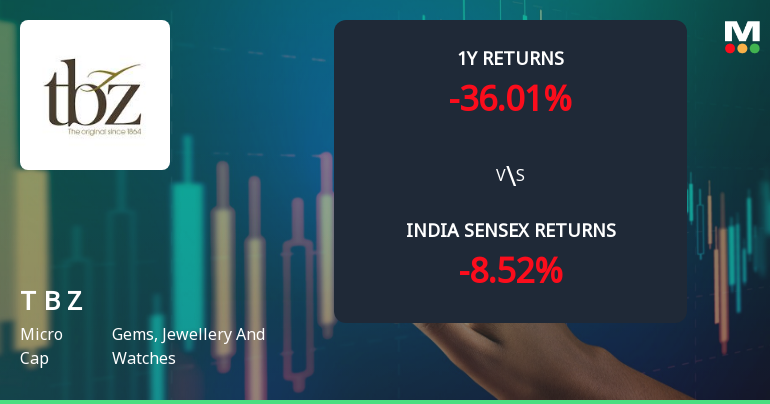
Total Returns (Price + Dividend) 
Latest dividend: 2.2 per share ex-dividend date: Sep-02-2025
Risk Adjusted Returns v/s
Returns Beta

News
Tribhovandas Bhimji Zaveri Ltd Technical Momentum Shifts Amid Mixed Market Signals
Tribhovandas Bhimji Zaveri Ltd (TBZ), a micro-cap player in the Gems, Jewellery and Watches sector, has experienced a notable shift in its technical momentum, moving from a bearish stance to a mildly bearish outlook. Despite a modest day gain of 1.24%, the stock’s broader technical indicators present a complex picture, reflecting mixed signals across weekly and monthly timeframes. This article analyses the recent technical parameter changes, key momentum indicators, and the stock’s relative performance against the Sensex to provide a comprehensive view for investors.
Read More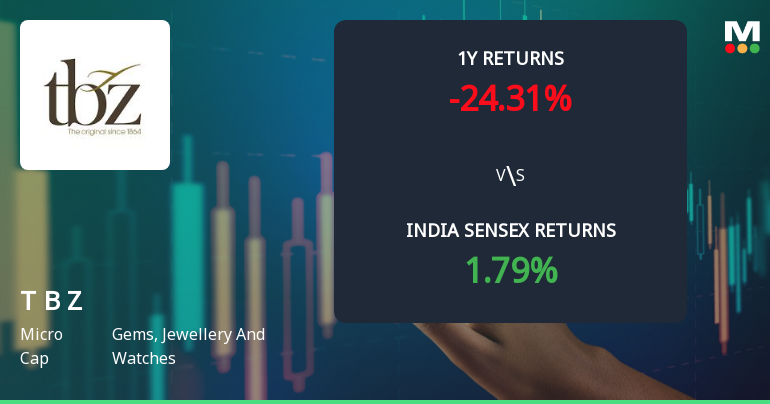
Tribhovandas Bhimji Zaveri Ltd Sees Technical Momentum Shift Amid Mixed Market Signals
Tribhovandas Bhimji Zaveri Ltd (TBZ), a micro-cap player in the Gems, Jewellery and Watches sector, has witnessed a notable shift in its technical momentum, reflecting a complex interplay of bullish and bearish signals. The stock’s recent 5.78% day gain to ₹149.10, coupled with a technical grade upgrade from Sell to Hold, underscores evolving market sentiment amid mixed indicator readings.
Read More
Tribhovandas Bhimji Zaveri Ltd is Rated Hold by MarketsMOJO
Tribhovandas Bhimji Zaveri Ltd is rated 'Hold' by MarketsMOJO, with this rating last updated on 20 January 2026. However, the analysis and financial metrics discussed here reflect the company’s current position as of 11 April 2026, providing investors with an up-to-date view of its fundamentals, valuation, financial trends, and technical outlook.
Read More Announcements
Clarification Letter For Significant Increase In Volume
16-Jun-2026 | Source : BSEClarification letter for significant increase in volume
Clarification sought from Tribhovandas Bhimji Zaveri Ltd
15-Jun-2026 | Source : BSEThe Exchange has sought clarification from Tribhovandas Bhimji Zaveri Ltd on June 15 2026 with reference to Movement in Volume.
The reply is awaited.
Board Meeting Outcome for Audited Financial Results Of The Company For The Financial Year Ended March 31 2026 And Recommendation Of Dividend.
27-May-2026 | Source : BSEThe Board of Directors at their meeting held today i.e. on May 27 2026 have approved the Audited Standalone and Consolidated Financial Results of the Company and have recommended Dividend for the period ended March 31 2026.
Corporate Actions

No Upcoming Board Meetings

Tribhovandas Bhimji Zaveri Ltd has declared 22% dividend, ex-date: 02 Sep 25

No Splits history available

No Bonus history available

No Rights history available
Quality key factors
Valuation key factors
Technicals key factors
 Technical Indicator Scale: Bearish, Mildly Bearish, Sideways, Mildly Bullish, Bullish Turned
 Shareholding Snapshot : Mar 2026
Shareholding Compare (%holding)
Promoters
None
Held by 0 Schemes
Held by 4 FIIs (0.26%)
Shrikant Gopaldas Zaveri (50.06%)
Vijaykumar Chhotabhai Kalidas Patel (1.03%)
21.36%
Quarterly Results Snapshot (Consolidated) - Dec'25 - YoY

YoY Growth in quarter ended Dec 2025 is 14.40% vs 25.21% in Dec 2024

YoY Growth in quarter ended Dec 2025 is 169.85% vs 39.37% in Dec 2024
Half Yearly Results Snapshot (Consolidated) - Sep'25
Growth in half year ended Sep 2025 is 12.77% vs 10.64% in Sep 2024
Growth in half year ended Sep 2025 is 86.18% vs 42.39% in Sep 2024
Nine Monthly Results Snapshot (Consolidated) - Dec'25
YoY Growth in nine months ended Dec 2025 is 13.49% vs 16.67% in Dec 2024
YoY Growth in nine months ended Dec 2025 is 128.62% vs 40.84% in Dec 2024
Annual Results Snapshot (Consolidated) - Mar'25
YoY Growth in year ended Mar 2025 is 13.99% vs -3.96% in Mar 2024
YoY Growth in year ended Mar 2025 is 25.65% vs 35.43% in Mar 2024
About Tribhovandas Bhimji Zaveri Ltd


