Stock DNA
Transport Services
INR 13,098 Cr ()
135.00
36
0.00%
0.00
0.00%
7.24
Total Returns (Price + Dividend) 
Shadowfax Techno for the last several years.
Risk Adjusted Returns v/s
Returns Beta

News
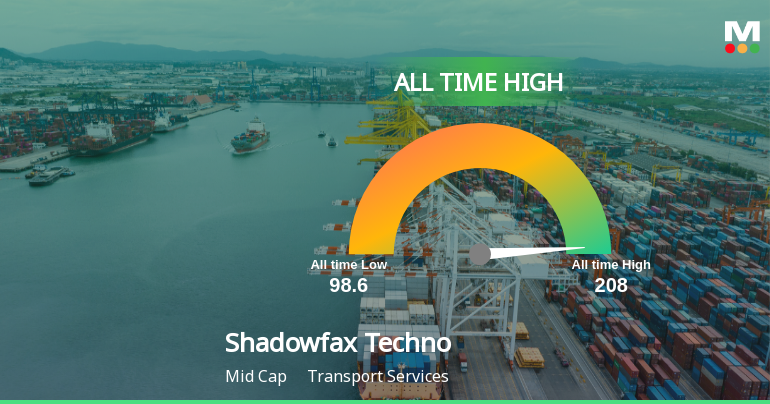
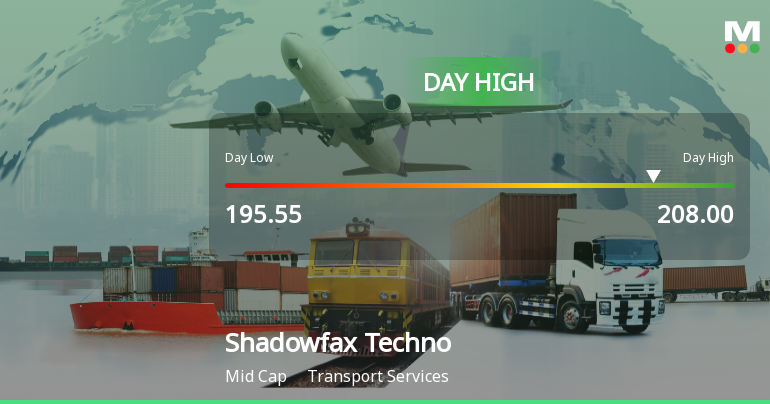
Shadowfax Technologies Ltd Surges 5.14% to Day's High of Rs 204.5 — Outperforms Sector by 3.02 Percentage Points
The Sensex edged higher by 0.32% on 21 May 2026, yet Shadowfax Technologies Ltd outpaced both the benchmark and its sector peers with a robust 5.14% gain, reaching a new 52-week and all-time high of Rs 204.5. That 3.02 percentage-point outperformance signals a distinctly stock-specific rally rather than a broad market lift.
Read More Announcements
Announcement under Regulation 30 (LODR)-Allotment of ESOP / ESPS
04-Jun-2026 | Source : BSEAllotment of 227955 Equity Shares of Rs. 10/- each to the eligible employees/ESOP holders
Announcement under Regulation 30 (LODR)-Analyst / Investor Meet - Intimation
03-Jun-2026 | Source : BSEShadowfax Technologies Limited has informed the Exchange about Schedule of Investors Conference / Analyst Meet
Announcement under Regulation 30 (LODR)-Analyst / Investor Meet - Intimation
03-Jun-2026 | Source : BSEShadowfax Technologies Limited has informed the Exchange about Schedule of Investors Conference / Analyst Meet
Corporate Actions

No Upcoming Board Meetings

No Dividend history available

No Splits history available

No Bonus history available

No Rights history available
Quality key factors
Valuation key factors
Technicals key factors
 Technical Indicator Scale: Bearish, Mildly Bearish, Sideways, Mildly Bullish, Bullish Turned
 Shareholding Snapshot : Mar 2026
Shareholding Compare (%holding)
Non Institution
None
Held by 10 Schemes (12.49%)
Held by 27 FIIs (7.65%)
Abhishek Bansal (9.33%)
Newquest Asia Fund Iv Singapore Pte Ltd (11.59%)
7.81%
Quarterly Results Snapshot (Standalone) - Dec'25 - QoQ

QoQ Growth in quarter ended Dec 2025 is 18.69% vs 35.66% in Sep 2025

QoQ Growth in quarter ended Dec 2025 is 156.71% vs 120.28% in Sep 2025
Annual Results Snapshot (Standalone) - Mar'25
YoY Growth in year ended Mar 2025 is 30.90% vs 33.19% in Mar 2024
YoY Growth in year ended Mar 2025 is 152.27% vs 91.67% in Mar 2024


