Stock DNA
Garments & Apparels
INR 4,906 Cr (Small Cap)
32.00
24
0.00%
0.13
0.83%
0.52
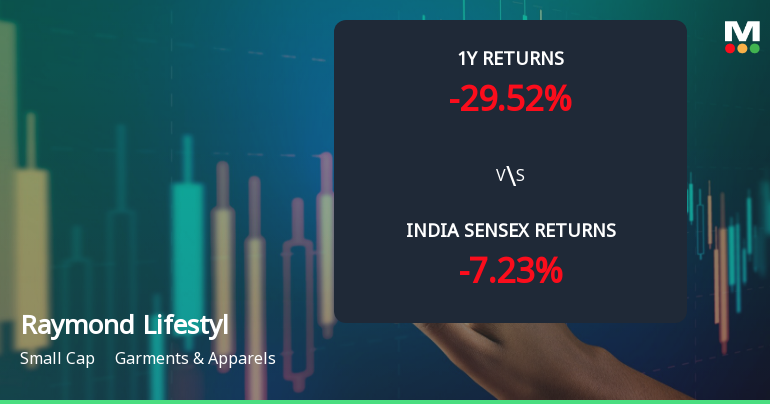
Total Returns (Price + Dividend) 
Raymond Lifestyl for the last several years.
Risk Adjusted Returns v/s
Returns Beta

News
Raymond Lifestyle Ltd Faces Intensified Downtrend Amid Technical Deterioration
Raymond Lifestyle Ltd, a small-cap player in the Garments & Apparels sector, has experienced a marked shift in technical momentum, signalling increased bearishness. The stock’s recent price action and technical indicators reveal a deteriorating trend, with the company’s Mojo Grade downgraded to Strong Sell as of 2 March 2026, reflecting growing investor caution amid sustained underperformance relative to the broader market.
Read More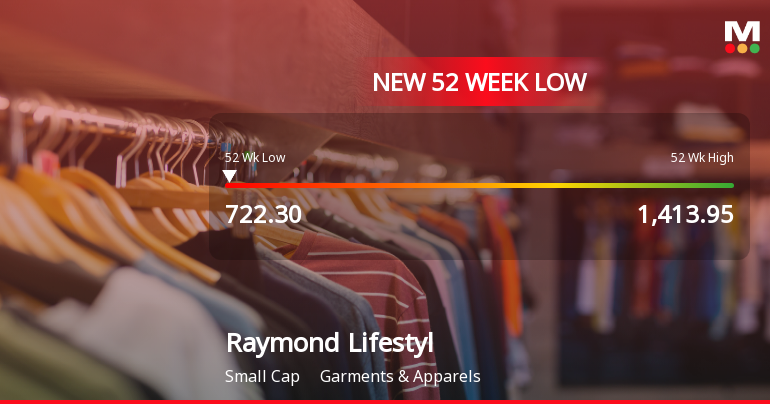
Five Consecutive Losses Push Raymond Lifestyle Ltd to a New 52-Week Low
For the fifth straight session, Raymond Lifestyle Ltd closed lower, breaching its 52-week low at Rs 722.3 on 20 May 2026, marking a near 10% decline over this losing streak.
Read More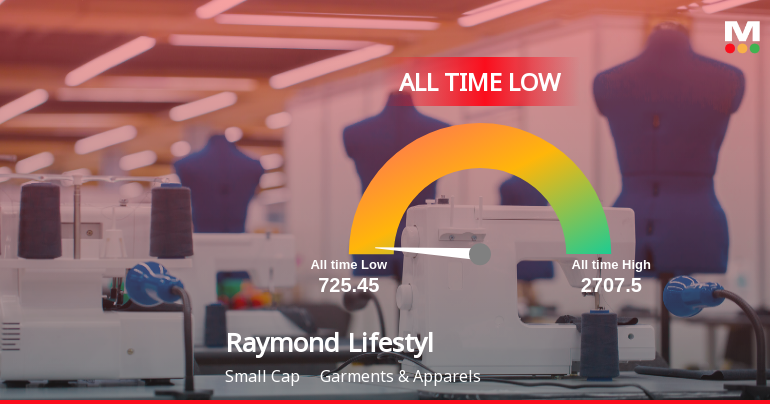
Raymond Lifestyle Ltd Extends Losing Streak to 5 Sessions, Touches All-Time Low
For the fifth consecutive session, Raymond Lifestyle Ltd closed lower, hitting an all-time low near Rs 725.45 on 20 May 2026. This persistent decline has pushed the stock to levels not seen before, despite some mixed signals from its financials and valuation metrics.
Read More Announcements
Corporate Action - Fixes Record Date For Payment Of Dividend And Annual General Meeting
16-Jun-2026 | Source : BSEPlease find attached intimation under Regulation 42 of the Listing Regulations.
Announcement Under Regulation 30 (LODR) Analyst/Investor Meet
04-Jun-2026 | Source : BSEPlease find attached intimation under Regulation 30 of Listing Regulations.
Disclosures under Reg. 31(1) and 31(2) of SEBI (SAST) Regulations 2011.
29-May-2026 | Source : BSEThe Exchange has received Disclosure under Regulation 31(1) and 31(2) of SEBI (Substantial Acquisition of Shares & Takeovers) Regulations 2011 on May 28 2026 for J K Investors (Bombay) Ltd
Corporate Actions

No Upcoming Board Meetings

No Dividend history available

No Splits history available

No Bonus history available

No Rights history available
Quality key factors
Valuation key factors
Technicals key factors
 Technical Indicator Scale: Bearish, Mildly Bearish, Sideways, Mildly Bullish, Bullish Turned
 Shareholding Snapshot : Mar 2026
Shareholding Compare (%holding)
Promoters
20.8426
Held by 10 Schemes (2.95%)
Held by 105 FIIs (8.7%)
J K Investors (bombay) Limited (38.02%)
Uti Value Fund (1.92%)
19.99%
Quarterly Results Snapshot (Consolidated) - Mar'26 - QoQ

QoQ Growth in quarter ended Mar 2026 is -3.91% vs 0.89% in Dec 2025
QoQ Growth in quarter ended Mar 2026 is -221.47% vs -43.00% in Dec 2025
Half Yearly Results Snapshot (Consolidated) - Sep'25

Growth in half year ended Sep 2025 is 11.42% vs -6.28% in Sep 2024
Growth in half year ended Sep 2025 is 191.88% vs -99.16% in Sep 2024
Nine Monthly Results Snapshot (Consolidated) - Dec'25
YoY Growth in nine months ended Dec 2025 is 9.16% vs -3.47% in Dec 2024
YoY Growth in nine months ended Dec 2025 is 18.15% vs -96.55% in Dec 2024
Annual Results Snapshot (Consolidated) - Mar'26
YoY Growth in year ended Mar 2026 is 11.52% vs -5.49% in Mar 2025
YoY Growth in year ended Mar 2026 is 20.90% vs -98.56% in Mar 2025
About Raymond Lifestyle Ltd

Company Coordinates