Dashboard
Healthy long term growth as Net Sales has grown by an annual rate of 26.88% and Operating profit at 23.93%
Flat results in Mar 26
Stock is technically in a Mildly Bullish range
With ROCE of 5.6, it has a Fair valuation with a 2.3 Enterprise value to Capital Employed
High Institutional Holdings at 26.19%
Stock DNA
Auto Components & Equipments
INR 10,743 Cr (Small Cap)
133.00
47
0.17%
0.87
7.27%
3.23
Total Returns (Price + Dividend) 
Latest dividend: 1 per share ex-dividend date: May-08-2026
Risk Adjusted Returns v/s
Returns Beta

News
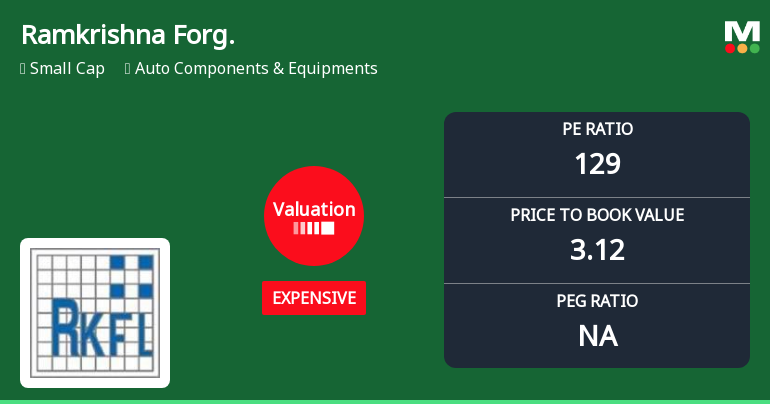
Ramkrishna Forgings Ltd Valuation Shifts Signal Price Attractiveness Challenges
Ramkrishna Forgings Ltd, a small-cap player in the Auto Components & Equipments sector, has seen its valuation parameters shift notably, raising questions about its price attractiveness amid a challenging market backdrop. Despite a recent upgrade in its Mojo Grade from Sell to Hold, the company’s elevated price-to-earnings (P/E) and price-to-book value (P/BV) ratios suggest investors should carefully weigh the stock’s premium against its fundamentals and sector peers.
Read More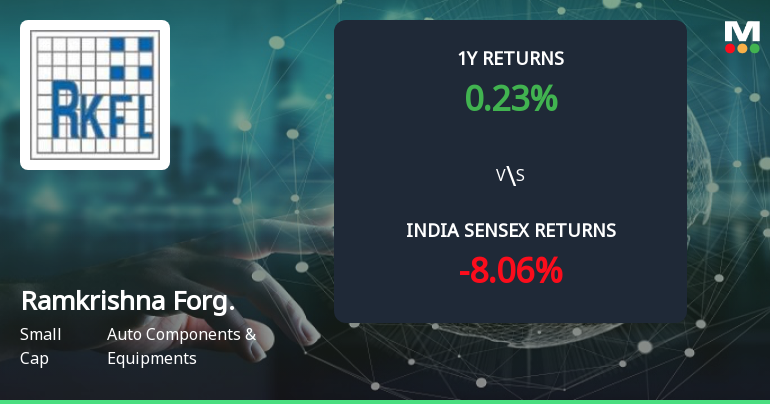
Golden Cross Forms in Ramkrishna Forgings Ltd — On a Day the Stock Fell Slightly. What the Mixed Signals Mean
The 50-day moving average has crossed above the 200-day moving average for Ramkrishna Forgings Ltd, signalling a golden cross on 13 May 2026. Yet, the stock slipped 0.03% on the day, and monthly technical indicators remain bearish. This divergence between the moving averages and other signals calls for a detailed examination of the cross's reliability.
Read More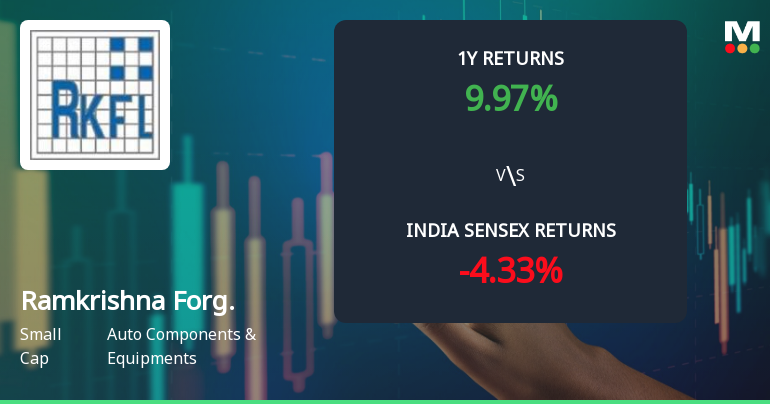
Ramkrishna Forgings Ltd Technical Momentum Shifts Amid Mixed Indicator Signals
Ramkrishna Forgings Ltd has exhibited a notable shift in its technical momentum, moving from a sideways trend to a mildly bearish stance, despite recent price gains. The stock’s mixed signals across key technical indicators such as MACD, RSI, and moving averages highlight a complex market sentiment as it navigates volatility within the auto components sector.
Read More Announcements
Disclosures under Reg. 29(1) of SEBI (SAST) Regulations 2011
11-Jun-2026 | Source : BSEThe Exchange has received the disclosure under Regulation 29(1) of SEBI (Substantial Acquisition of Shares & Takeovers) Regulations 2011 for Riddhi Portfolio Pvt Ltd & PACs
Disclosures under Reg. 29(2) of SEBI (SAST) Regulations 2011
11-Jun-2026 | Source : BSEThe Exchange has received the disclosure under Regulation 29(2) of SEBI (Substantial Acquisition of Shares & Takeovers) Regulations 2011 for Riddhi Portfolio Pvt Ltd & PACs
Disclosures under Reg. 29(2) of SEBI (SAST) Regulations 2011
11-Jun-2026 | Source : BSEThe Exchange has received the disclosure under Regulation 29(2) of SEBI (Substantial Acquisition of Shares & Takeovers) Regulations 2011 for Riddhi Portfolio Pvt Ltd & PACs
Corporate Actions

No Upcoming Board Meetings

Ramkrishna Forgings Ltd has declared 50% dividend, ex-date: 08 May 26

Ramkrishna Forgings Ltd has announced 2:10 stock split, ex-date: 14 Mar 22

No Bonus history available

No Rights history available
Quality key factors
Valuation key factors
Technicals key factors
 Technical Indicator Scale: Bearish, Mildly Bearish, Sideways, Mildly Bullish, Bullish Turned
 Shareholding Snapshot : Mar 2026
Shareholding Compare (%holding)
Promoters
15.6271
Held by 18 Schemes (1.33%)
Held by 122 FIIs (21.74%)
Riddhi Portfolio Private Ltd (34.65%)
Smallcap World Fund, Inc (7.97%)
20.03%
Quarterly Results Snapshot (Consolidated) - Mar'26 - QoQ

QoQ Growth in quarter ended Mar 2026 is 10.77% vs 21.05% in Dec 2025

QoQ Growth in quarter ended Mar 2026 is 312.23% vs 242.84% in Dec 2025
Half Yearly Results Snapshot (Consolidated) - Sep'25
Growth in half year ended Sep 2025 is -4.49% vs 16.03% in Sep 2024
Growth in half year ended Sep 2025 is -98.82% vs 20.91% in Sep 2024
Nine Monthly Results Snapshot (Consolidated) - Dec'25
YoY Growth in nine months ended Dec 2025 is -2.12% vs 13.05% in Dec 2024
YoY Growth in nine months ended Dec 2025 is -92.63% vs -13.07% in Dec 2024
Annual Results Snapshot (Consolidated) - Mar'26
YoY Growth in year ended Mar 2026 is 5.06% vs 8.90% in Mar 2025
YoY Growth in year ended Mar 2026 is -82.70% vs 42.52% in Mar 2025
About Ramkrishna Forgings Ltd


