Dashboard
Weak Long Term Fundamental Strength with an average Return on Equity (ROE) of 0%
- Poor long term growth as Operating profit has grown by an annual rate of 23.35%
Stock is technically in a Mildly Bearish range
Risky - Negative EBITDA
Despite the size of the company, domestic mutual funds hold only 0.89% of the company
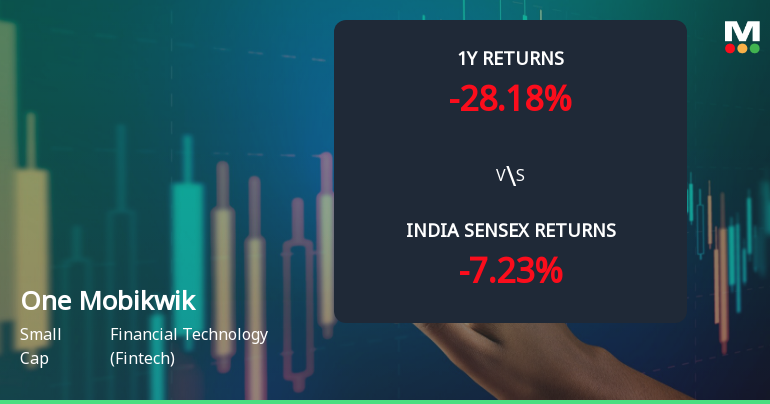
Underperformed the market in the last 1 year
Stock DNA
Financial Technology (Fintech)
INR 1,571 Cr (Small Cap)
NA (Loss Making)
21
0.00%
0.65
-32.48%
2.90
Total Returns (Price + Dividend) 
One Mobikwik for the last several years.
Risk Adjusted Returns v/s
Returns Beta

News
One Mobikwik Systems Ltd Technical Momentum Shifts Amid Bearish Signals
One Mobikwik Systems Ltd, a small-cap player in the Financial Technology sector, has experienced a subtle shift in its technical momentum, moving from a sideways trend to a mildly bearish stance. Despite some mildly bullish signals on weekly MACD and KST indicators, the overall technical landscape suggests caution for investors as the stock grapples with downward pressure and a recent downgrade to a Strong Sell rating by MarketsMOJO.
Read More
One Mobikwik Systems Ltd Surges 8.19% to Day's High of Rs 202 — Outperforms Sector by 6.13 Percentage Points
The Sensex advanced 0.38% on 19 Jun 2026, yet One Mobikwik Systems Ltd outpaced both the benchmark and its sector peers with an 8.19% intraday gain, reaching a high of Rs 202. This 6.13 percentage-point outperformance signals a stock-specific surge rather than a market-wide lift.
Read MoreAre One Mobikwik Systems Ltd latest results good or bad?
One Mobikwik Systems Ltd's latest financial results for Q4 FY26 reflect a complex operational landscape. The company reported a net profit of ₹4.38 crores, representing an 8.15% increase from the previous quarter, marking only the second consecutive profitable quarter in its recent history. However, this achievement is tempered by a slight decline in revenue, which totaled ₹288.71 crores, down 0.08% from the prior quarter. Year-on-year, revenue showed a modest growth of 7.82%, indicating some topline expansion amidst a competitive fintech environment. The operating margin, excluding other income, improved to 3.49%, the highest in eight quarters, suggesting enhanced cost discipline. This positive trend in operating margins contrasts with the company's ongoing challenges, particularly its heavy reliance on non-operating income, which constituted 88.73% of profit before tax in the latest quarter. Such depende...
Read More Announcements
Announcement under Regulation 30 (LODR)-Newspaper Publication
03-Jun-2026 | Source : BSENewspaper Publication for the Notice of Postal Ballot remote e-voting information and Form PAS-1 (Public Notice)
Shareholder Meeting / Postal Ballot-Notice of Postal Ballot
02-Jun-2026 | Source : BSENotice of Postal Ballot
Announcement under Regulation 30 (LODR)-Analyst / Investor Meet - Intimation
29-May-2026 | Source : BSEIntimation of Schedule of Analyst/ Investors Meeting
Corporate Actions

No Upcoming Board Meetings

No Dividend history available

No Splits history available

No Bonus history available

No Rights history available
Quality key factors
Valuation key factors
Technicals key factors
 Technical Indicator Scale: Bearish, Mildly Bearish, Sideways, Mildly Bullish, Bullish Turned
 Shareholding Snapshot : Mar 2026
Shareholding Compare (%holding)
Non Institution
None
Held by 2 Schemes (0.67%)
Held by 9 FIIs (4.25%)
Bipin Preet Singh (14.52%)
Bajaj Finance Limited (10.14%)
35.06%
Quarterly Results Snapshot (Consolidated) - Mar'26 - QoQ

QoQ Growth in quarter ended Mar 2026 is -0.08% vs 6.94% in Dec 2025
QoQ Growth in quarter ended Mar 2026 is 8.15% vs 114.15% in Dec 2025
Half Yearly Results Snapshot (Consolidated) - Sep'25
Growth in half year ended Sep 2025 is -14.43% vs 66.08% in Sep 2024
Growth in half year ended Sep 2025 is -590.89% vs -207.70% in Sep 2024
Nine Monthly Results Snapshot (Consolidated) - Dec'25
YoY Growth in nine months ended Dec 2025 is -7.96% vs 47.93% in Dec 2024

YoY Growth in nine months ended Dec 2025 is -1.53% vs -544.00% in Dec 2024
Annual Results Snapshot (Consolidated) - Mar'26
YoY Growth in year ended Mar 2026 is -4.35% vs 33.73% in Mar 2025
YoY Growth in year ended Mar 2026 is 48.90% vs -963.14% in Mar 2025
About One Mobikwik Systems Ltd

Company Coordinates