Dashboard
Weak Long Term Fundamental Strength with an average Return on Equity (ROE) of 4.59%
- Poor long term growth as Net Sales has grown by an annual rate of 4.23%
Stock is technically in a Bearish range
With ROE of 1.9, it has a Expensive valuation with a 0.5 Price to Book Value
80.53% of Promoter Shares are Pledged
Consistent Underperformance against the benchmark over the last 3 years
Stock DNA
Non Banking Financial Company (NBFC)
INR 328 Cr (Micro Cap)
26.00
21
0.00%
4.56
2.61%
0.50
Total Returns (Price + Dividend) 
Latest dividend: 4.9999986666666665 per share ex-dividend date: Mar-17-2016
Risk Adjusted Returns v/s
Returns Beta

News
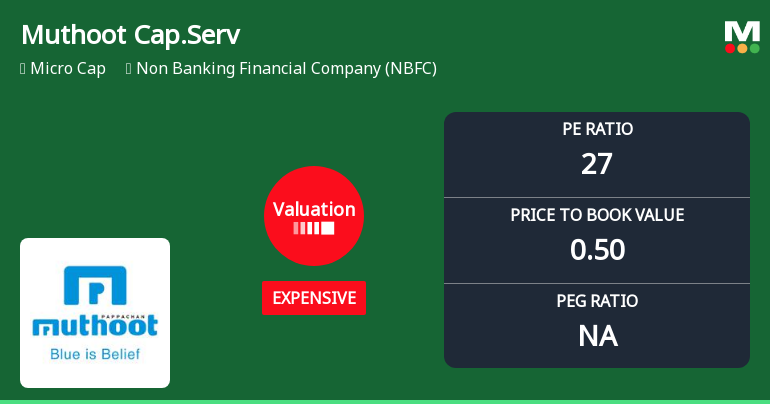
Muthoot Capital Services Ltd Valuation Shifts Signal Elevated Price Risk
Muthoot Capital Services Ltd, a micro-cap player in the Non Banking Financial Company (NBFC) sector, has seen its valuation parameters shift notably towards the expensive territory, raising concerns about its price attractiveness relative to historical and peer benchmarks. Despite a modest day gain of 2.28%, the stock’s elevated price-to-earnings (P/E) ratio and subdued return metrics suggest caution for investors amid a challenging market backdrop.
Read MoreAre Muthoot Capital Services Ltd latest results good or bad?
Muthoot Capital Services Ltd's latest financial results for the quarter ended March 2026 present a complex picture of performance. The company achieved net sales of ₹166.36 crores, reflecting a year-on-year growth of 21.29%, which marks a notable achievement as it represents the highest quarterly revenue on record. However, this top-line growth did not translate into improved profitability. The standalone net profit for the same quarter was ₹5.37 crores, which signifies a decline of 16.35% compared to the previous year. The profit after tax (PAT) margin has contracted significantly to 3.23%, down from 4.94% in the previous quarter, indicating challenges in maintaining profitability despite revenue growth. This compression in margins is attributed to rising interest costs, which increased by 14.71% year-on-year, and a decline in operational efficiency, as evidenced by the operating profit margin dropping t...
Read More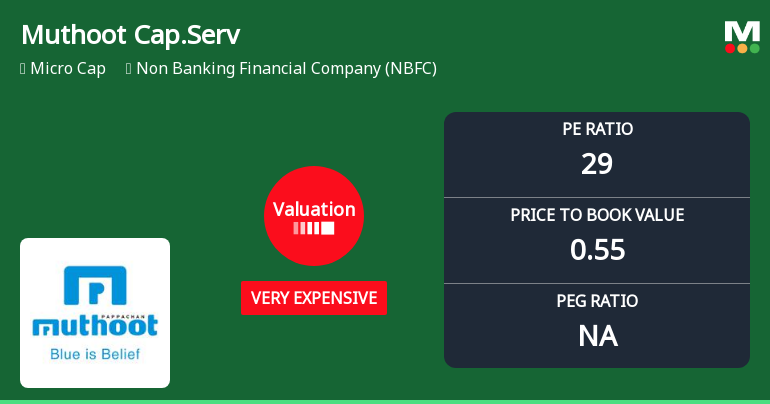
Muthoot Capital Services Ltd Valuation Shifts Signal Heightened Price Risk
Muthoot Capital Services Ltd, a micro-cap player in the Non Banking Financial Company (NBFC) sector, has seen its valuation metrics shift markedly, moving from expensive to very expensive territory. Despite a recent downgrade to a Strong Sell rating, the stock’s price-to-earnings (P/E) ratio and other valuation parameters suggest a premium that is increasingly difficult to justify given its subdued returns relative to benchmarks and peers.
Read More Announcements
Announcement under Regulation 30 (LODR)-Credit Rating
09-Jun-2026 | Source : BSEIntimation on upgradation of Long-term rating to Crisil AA-/Crisil PPMLD AA-/Stable and reaffirmation of Short-term rating
Announcement under Regulation 30 (LODR)-Raising of Funds
08-Jun-2026 | Source : BSERaising of funds through Securitization
Submission Of ESOP Trust Deed
22-May-2026 | Source : BSESubmission of ESOP Trust Deed
Corporate Actions

No Upcoming Board Meetings

Muthoot Capital Services Ltd has declared 55% dividend, ex-date: 17 Mar 16

No Splits history available

Muthoot Capital Services Ltd has announced 1:10 bonus issue, ex-date: 12 Jun 17

Muthoot Capital Services Ltd has announced 1:1 rights issue, ex-date: 24 May 11
Quality key factors
Valuation key factors
Technicals key factors
 Technical Indicator Scale: Bearish, Mildly Bearish, Sideways, Mildly Bullish, Bullish Turned
 Shareholding Snapshot : Mar 2026
Shareholding Compare (%holding)
Promoters
80.5323
Held by 0 Schemes
Held by 3 FIIs (1.3%)
Thomas John Muthoot (19.17%)
Thermo Capital Private Limited (2.95%)
24.34%
Quarterly Results Snapshot (Standalone) - Mar'26 - YoY

YoY Growth in quarter ended Mar 2026 is 21.29% vs 40.23% in Mar 2025

YoY Growth in quarter ended Mar 2026 is -16.36% vs -45.03% in Mar 2025
Half Yearly Results Snapshot (Standalone) - Sep'25
Growth in half year ended Sep 2025 is 43.40% vs 2.16% in Sep 2024
Growth in half year ended Sep 2025 is -106.87% vs -73.48% in Sep 2024
Nine Monthly Results Snapshot (Standalone) - Dec'25
YoY Growth in nine months ended Dec 2025 is 35.91% vs 11.44% in Dec 2024
YoY Growth in nine months ended Dec 2025 is -85.23% vs -64.56% in Dec 2024
Annual Results Snapshot (Standalone) - Mar'26
YoY Growth in year ended Mar 2026 is 31.67% vs 18.66% in Mar 2025
YoY Growth in year ended Mar 2026 is -75.58% vs -62.70% in Mar 2025
About Muthoot Capital Services Ltd


