Stock DNA
E-Retail/ E-Commerce
INR 76,056 Cr ()
NA (Loss Making)
76
0.00%
0.00
0.00%
17.23
Total Returns (Price + Dividend) 
Meesho for the last several years.
Risk Adjusted Returns v/s
Returns Beta

News

Meesho Ltd Upgraded to Sell by MarketsMOJO on Improving Technicals
Meesho Ltd, a mid-cap player in the E-Retail and E-Commerce sector, has seen its investment rating upgraded from Strong Sell to Sell as of 19 May 2026. This change reflects a nuanced shift in the company’s technical outlook despite persistent fundamental challenges, signalling cautious optimism among investors.
Read More
Meesho Ltd is Rated Strong Sell
Meesho Ltd is rated Strong Sell by MarketsMOJO, with this rating last updated on 11 May 2026. However, the analysis and financial metrics discussed here reflect the stock’s current position as of 19 May 2026, providing investors with the latest insights into the company’s fundamentals, valuation, financial trend, and technical outlook.
Read More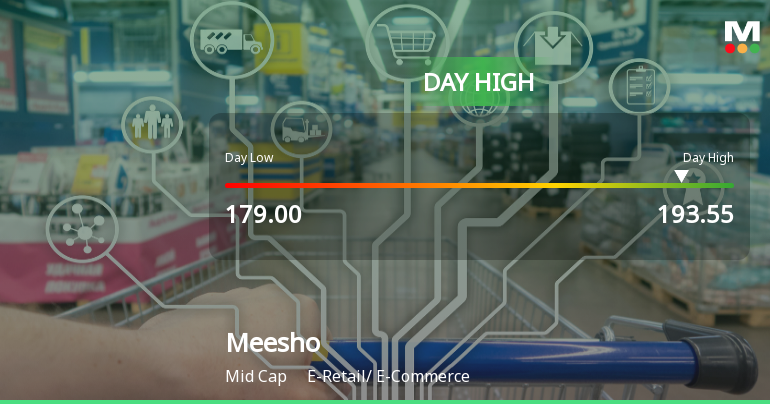
Meesho Ltd Surges 6.01% to Day's High of Rs 192.5 — Outperforms Sector by 5.21 Percentage Points
The Sensex inched up 0.09% after a volatile session, but Meesho Ltd outperformed sharply with a 6.01% gain, touching an intraday high of Rs 192.5. This 5.21 percentage-point outperformance over its E-Retail/ E-Commerce sector peers signals a distinctly stock-specific move rather than a broad market lift.
Read More Announcements
Closure of Trading Window
15-Jun-2026 | Source : BSEIntimation w.r.t Closure of Trading Window
Announcement under Regulation 30 (LODR)-Acquisition
12-Jun-2026 | Source : BSEIntimation under Regulation 30 of SEBI (LODR) Regulations 2015
Announcement under Regulation 30 (LODR)-Press Release / Media Release
12-Jun-2026 | Source : BSEIntimation w.r.t Press Release
Corporate Actions

No Upcoming Board Meetings

No Dividend history available

No Splits history available

No Bonus history available

No Rights history available
Quality key factors
Valuation key factors
Technicals key factors
 Technical Indicator Scale: Bearish, Mildly Bearish, Sideways, Mildly Bullish, Bullish Turned
 Shareholding Snapshot : Mar 2026
Shareholding Compare (%holding)
Non Institution
None
Held by 23 Schemes (4.91%)
Held by 113 FIIs (4.17%)
Vidit Aatrey (10.0%)
Elevation Capital V Limited (12.16%)
2.63%
Quarterly Results Snapshot (Standalone) - Mar'26 - QoQ

QoQ Growth in quarter ended Mar 2026 is -12.66% vs 13.50% in Dec 2025
QoQ Growth in quarter ended Mar 2026 is -56.43% vs 3,180.55% in Dec 2025
Annual Results Snapshot (Consolidated) - Mar'26

YoY Growth in year ended Mar 2026 is 34.47% vs 23.31% in Mar 2025
YoY Growth in year ended Mar 2026 is 65.55% vs -1,103.06% in Mar 2025


