Dashboard
Strong Long Term Fundamental Strength with an average Return on Equity (ROE) of 18.78%
Healthy long term growth as Operating profit has grown by an annual rate of 30.16%
Positive results in Mar 26
Stock is technically in a Mildly Bearish range
With ROE of 15.4, it has a Very Attractive valuation with a 1.4 Price to Book Value
Despite the size of the company, domestic mutual funds hold only 0% of the company
Underperformed the market in the last 1 year
Stock DNA
Capital Markets
INR 974 Cr (Small Cap)
8.00
21
0.00%
0.22
15.68%
1.20
Total Returns (Price + Dividend) 
Latest dividend: 0.1 per share ex-dividend date: Sep-21-2018
Risk Adjusted Returns v/s
Returns Beta

News
Are Master Trust Ltd latest results good or bad?
Master Trust Ltd's latest financial results for Q4 FY26 present a mixed picture. The company reported a significant year-on-year increase in net sales, reaching ₹180.61 crores, which marks a robust growth of 48.07%. Sequentially, this also reflects a substantial increase of 32.10% from the previous quarter. Additionally, net profit for the quarter stood at ₹36.06 crores, up 46.88% year-on-year and 14.40% compared to the previous quarter, indicating strong profitability momentum. However, the operational margins reveal a more complex scenario. The operating margin for Q4 FY26 was recorded at 35.44%, which represents a notable contraction from the previous year's margin of 43.32%. This decline of 789 basis points raises concerns about the sustainability of profit margins, particularly in light of a significant increase in employee costs, which nearly doubled compared to the previous year. This suggests poten...
Read MoreWhen is the next results date for Master Trust Ltd?
The next results date for Master Trust Ltd is scheduled for 12 May 2026....
Read More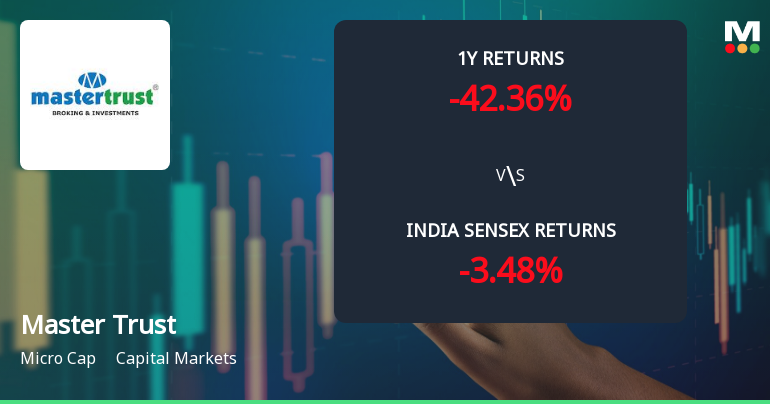
Master Trust Ltd Technical Momentum Shifts Amid Mixed Market Signals
Master Trust Ltd, a micro-cap player in the capital markets sector, has exhibited a notable shift in technical momentum, reflecting a complex interplay of bullish and bearish signals across multiple timeframes. Despite a strong day gain of 7.54%, the stock’s overall technical indicators present a nuanced picture that investors must carefully analyse amid its recent downgrade from Hold to Sell by MarketsMOJO.
Read More Announcements
Compliances-Reg.24(A)-Annual Secretarial Compliance
28-May-2026 | Source : BSEAnnual Secretarial Compliance Report as on 31st March 2026
Announcement under Regulation 30 (LODR)-Allotment of ESOP / ESPS
16-May-2026 | Source : BSEGrant of 945200 stock options under Master Trust Limited Employee Stock Option Plan 2025 (the ESOP 2025) to the eligible employees.
Declaration Regarding Unmodified Opinion Of The Auditors On The Audited Financial Results (Standalone And Consolidated) Of The Company For The Financial Year Ended 31.03.2026
12-May-2026 | Source : BSEPlease find attached the Unmodified Opinion of the Auditors on the Audited Financial Results (Standalone and Consolidated) of the Company for the Financial Year ended 31.03.2026
Corporate Actions

No Upcoming Board Meetings

Master Trust Ltd has declared 10% dividend, ex-date: 21 Sep 18

Master Trust Ltd has announced 1:5 stock split, ex-date: 30 Oct 24

No Bonus history available

No Rights history available
Quality key factors
Valuation key factors
Technicals key factors
 Technical Indicator Scale: Bearish, Mildly Bearish, Sideways, Mildly Bullish, Bullish Turned
 Shareholding Snapshot : Mar 2026
Shareholding Compare (%holding)
Promoters
16.9516
Held by 0 Schemes
Held by 3 FIIs (0.02%)
Rajinder Kumar Singhania (23.35%)
G S Auto Leasing Limited (10.86%)
9.67%
Quarterly Results Snapshot (Consolidated) - Mar'26 - QoQ

QoQ Growth in quarter ended Mar 2026 is 32.10% vs 7.77% in Dec 2025
QoQ Growth in quarter ended Mar 2026 is 14.40% vs 0.38% in Dec 2025
Half Yearly Results Snapshot (Consolidated) - Sep'25

Growth in half year ended Sep 2025 is -17.68% vs 47.65% in Sep 2024
Growth in half year ended Sep 2025 is -18.21% vs 68.45% in Sep 2024
Nine Monthly Results Snapshot (Consolidated) - Dec'25
YoY Growth in nine months ended Dec 2025 is -14.43% vs 37.33% in Dec 2024
YoY Growth in nine months ended Dec 2025 is -15.62% vs 51.96% in Dec 2024
Annual Results Snapshot (Consolidated) - Mar'26
YoY Growth in year ended Mar 2026 is -1.39% vs 16.66% in Mar 2025
YoY Growth in year ended Mar 2026 is -3.92% vs 21.43% in Mar 2025
About Master Trust Ltd


