Dashboard
Weak Long Term Fundamental Strength with a -36.99% CAGR growth in Operating Profits over the last 5 years
- Low ability to service debt as the company has a high Debt to EBITDA ratio of 4.83 times
- The company has been able to generate a Return on Equity (avg) of 6.28% signifying low profitability per unit of shareholders funds
Stock is technically in a Mildly Bearish range
Consistent Underperformance against the benchmark over the last 3 years
Stock DNA
Packaging
INR 896 Cr (Micro Cap)
NA (Loss Making)
36
0.66%
0.71
0.48%
1.14
Total Returns (Price + Dividend) 
Latest dividend: 0.6 per share ex-dividend date: Sep-19-2025
Risk Adjusted Returns v/s
Returns Beta

News
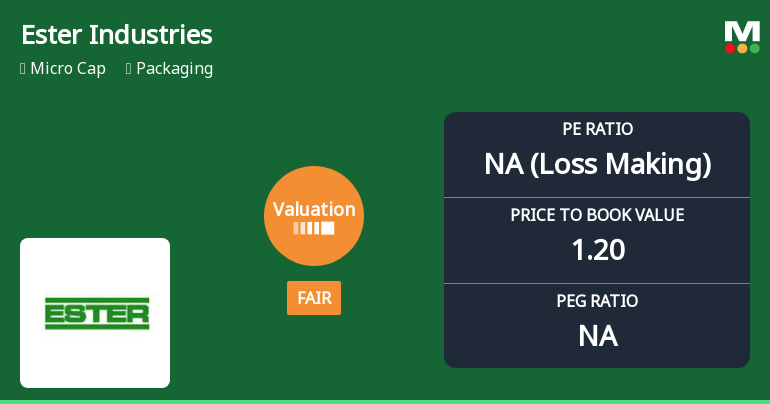
Ester Industries Ltd Valuation Shifts: From Attractive to Fair Amid Market Challenges
Ester Industries Ltd, a micro-cap player in the packaging sector, has seen a notable shift in its valuation parameters, moving from an attractive to a fair valuation grade. Despite a recent downgrade in its overall Mojo Grade from Strong Sell to Sell, the company’s price-to-earnings (P/E) and price-to-book value (P/BV) ratios reveal a nuanced picture when analysed against historical trends and peer benchmarks.
Read More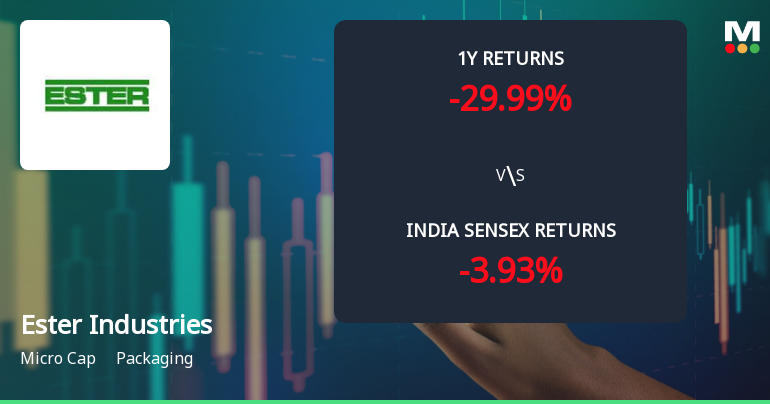
Ester Industries Ltd Faces Technical Headwinds Amid Weak Price Momentum
Ester Industries Ltd, a micro-cap player in the packaging sector, is currently grappling with a challenging technical landscape as key momentum indicators signal persistent weakness. Despite a recent mild shift from strongly bearish to mildly bearish technical trends, the stock continues to underperform benchmarks such as the Sensex, reflecting ongoing investor caution and subdued price action.
Read More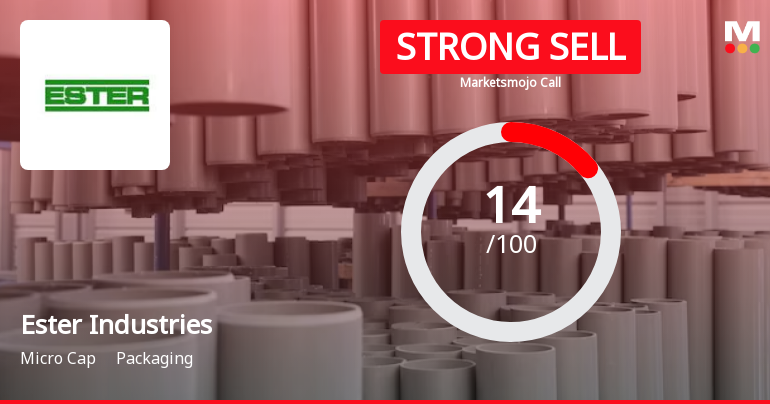
Ester Industries Ltd is Rated Strong Sell
Ester Industries Ltd is rated Strong Sell by MarketsMOJO. This rating was last updated on 30 July 2025. However, the analysis and financial metrics discussed here reflect the stock’s current position as of 11 April 2026, providing investors with the latest insights into the company’s performance and outlook.
Read More Announcements
Compliances-Certificate under Reg. 74 (5) of SEBI (DP) Regulations 2018
02-Jun-2026 | Source : BSECertificate under Regulation 74(5) of SEBI (DP) Regulations 2018
Announcement under Regulation 30 (LODR)-Newspaper Publication
02-Jun-2026 | Source : BSENewspaper Publication for Special Window for Transfer and Dematerialisation of Physical Securities and 100 Days Campaign - Saksham Niveshak: 1st April 2026 to 9th July 2026
Compliances-Reg.24(A)-Annual Secretarial Compliance
28-May-2026 | Source : BSEAnnual Secretarial Compliance Report for the Financial Year ended 31st March 2026
Corporate Actions

No Upcoming Board Meetings

Ester Industries Ltd has declared 12% dividend, ex-date: 19 Sep 25

No Splits history available

No Bonus history available

No Rights history available
Quality key factors
Valuation key factors
Technicals key factors
 Technical Indicator Scale: Bearish, Mildly Bearish, Sideways, Mildly Bullish, Bullish Turned
 Shareholding Snapshot : May 2026
Shareholding Compare (%holding)
Promoters
None
Held by 1 Schemes (0.01%)
Held by 5 FIIs (0.03%)
Wilemina Finance Corp. (50.54%)
Vettel International Limitted (8.29%)
20.49%
Quarterly Results Snapshot (Consolidated) - Mar'26 - QoQ

QoQ Growth in quarter ended Mar 2026 is 1.43% vs -4.29% in Dec 2025
QoQ Growth in quarter ended Mar 2026 is 163.42% vs 21.36% in Dec 2025
Half Yearly Results Snapshot (Consolidated) - Sep'25

Growth in half year ended Sep 2025 is 12.16% vs 18.95% in Sep 2024
Growth in half year ended Sep 2025 is -75.31% vs 75.09% in Sep 2024
Nine Monthly Results Snapshot (Consolidated) - Dec'25
YoY Growth in nine months ended Dec 2025 is 7.11% vs 22.39% in Dec 2024
YoY Growth in nine months ended Dec 2025 is -401.02% vs 112.06% in Dec 2024
Annual Results Snapshot (Consolidated) - Mar'26
YoY Growth in year ended Mar 2026 is 7.26% vs 20.56% in Mar 2025
YoY Growth in year ended Mar 2026 is -300.51% vs 111.32% in Mar 2025
About Ester Industries Ltd


