Dashboard
With HIgh Debt (Debt-Equity Ratio at 9.48 times)- the company has a Weak Long Term Fundamental Strength
- Poor long term growth as Net Sales has grown by an annual rate of 1.71% over the last 5 years
- High Debt Company with a Debt to Equity ratio (avg) at 3.39 times
Stock is technically in a Mildly Bearish range
Risky - Negative EBITDA
Despite the size of the company, domestic mutual funds hold only 0.03% of the company
Stock DNA
Industrial Manufacturing
INR 628 Cr (Micro Cap)
NA (Loss Making)
47
0.00%
9.48
89.74%
615.27
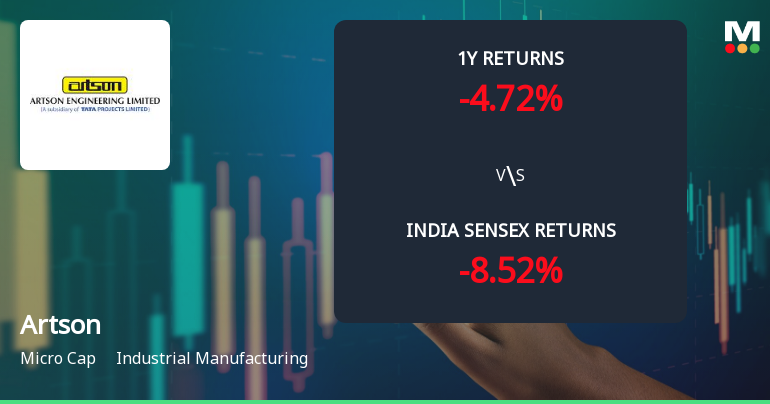
Total Returns (Price + Dividend) 
Artson for the last several years.
Risk Adjusted Returns v/s
Returns Beta

News
Artson Ltd Technical Momentum Shifts Amid Mixed Indicator Signals
Artson Ltd, a micro-cap player in the industrial manufacturing sector, has experienced a notable shift in its technical momentum, reflecting a complex interplay of bullish and bearish signals across multiple timeframes. Despite a recent downgrade to a Strong Sell rating with a Mojo Score of 23.0, the stock’s price action and technical indicators reveal a nuanced picture that investors should carefully analyse.
Read More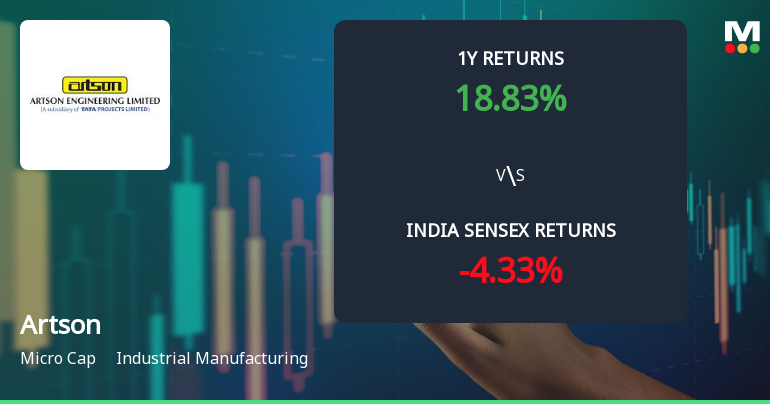
Artson Ltd Technical Momentum Shifts Amid Mixed Indicator Signals
Artson Ltd, a micro-cap player in the industrial manufacturing sector, has exhibited a notable shift in price momentum, reflected in a complex interplay of technical indicators. Despite a strong day change of 6.66%, the stock’s technical parameters reveal a nuanced picture, oscillating between mildly bearish and sideways trends, prompting a cautious outlook for investors.
Read More
Artson Ltd Technical Momentum Shifts Amid Mixed Market Signals
Artson Ltd, a micro-cap player in the industrial manufacturing sector, has recently exhibited a nuanced shift in its technical momentum, reflecting a complex interplay of bullish and bearish signals across multiple timeframes. Despite a modest day gain of 1.23%, the stock’s technical indicators reveal a cautious outlook, with a recent downgrade to a Strong Sell rating by MarketsMOJO underscoring investor concerns.
Read More Announcements
Announcement under Regulation 30 (LODR)-Award_of_Order_Receipt_of_Order
12-Jun-2026 | Source : BSEReceipt of Purchase Order from Deepak Chem Tech Limited for an amont of Rs. 5.39 Crores (excluding taxes) - details enclosed.
Shareholder Meeting / Postal Ballot-Scrutinizers Report
23-May-2026 | Source : BSEVoting results and scrutinsers report of Postal Ballot through remote e-voting - details enclosed.
Shareholder Meeting / Postal Ballot-Outcome of Postal_Ballot
23-May-2026 | Source : BSEVoting results and scrutinizers report of Postal Ballot through remote e-voting - details enclosed.
Corporate Actions

No Upcoming Board Meetings

No Dividend history available

Artson Ltd has announced 1:10 stock split, ex-date: 01 Feb 08

No Bonus history available

No Rights history available
Quality key factors
Valuation key factors
Technicals key factors
 Technical Indicator Scale: Bearish, Mildly Bearish, Sideways, Mildly Bullish, Bullish Turned
 Shareholding Snapshot : Mar 2026
Shareholding Compare (%holding)
Promoters
None
Held by 2 Schemes (0.01%)
Held by 3 FIIs (0.0%)
Tata Projects Limited (75.0%)
Consortium Securities Private Limited (1.08%)
19.84%
Quarterly Results Snapshot (Standalone) - Mar'26 - QoQ

QoQ Growth in quarter ended Mar 2026 is 21.25% vs -33.58% in Dec 2025
QoQ Growth in quarter ended Mar 2026 is 127.50% vs -445.54% in Dec 2025
Half Yearly Results Snapshot (Standalone) - Sep'25
Growth in half year ended Sep 2025 is 108.74% vs -38.22% in Sep 2024
Growth in half year ended Sep 2025 is 42.29% vs -182.55% in Sep 2024
Nine Monthly Results Snapshot (Standalone) - Dec'25
YoY Growth in nine months ended Dec 2025 is 100.37% vs -39.66% in Dec 2024

YoY Growth in nine months ended Dec 2025 is -594.44% vs -39.11% in Dec 2024
Annual Results Snapshot (Standalone) - Mar'26
YoY Growth in year ended Mar 2026 is 44.06% vs -11.37% in Mar 2025
YoY Growth in year ended Mar 2026 is -412.64% vs -42.48% in Mar 2025
About Artson Ltd


