Dashboard
Weak Long Term Fundamental Strength with a -15.14% CAGR growth in Operating Profits over the last 5 years
- Company's ability to service its debt is weak with a poor EBIT to Interest (avg) ratio of 0.02
- The company has been able to generate a Return on Equity (avg) of 2.44% signifying low profitability per unit of shareholders funds
Stock is technically in a Mildly Bearish range
Consistent Underperformance against the benchmark over the last 3 years
Stock DNA
Pharmaceuticals & Biotechnology
INR 17 Cr (Micro Cap)
370,549,614,556,095,104.00
34
0.00%
-0.15
-0.80%
2.22
Total Returns (Price + Dividend) 
Zenith Health for the last several years.
Risk Adjusted Returns v/s
Returns Beta

News
When is the next results date for Zenith Health Care Ltd?
The next results date for Zenith Health Care Ltd is scheduled for 29 May 2026....
Read More
Zenith Health Care Ltd Valuation Shifts Signal Elevated Price Risk Amid Weak Returns
Zenith Health Care Ltd, a micro-cap player in the Pharmaceuticals & Biotechnology sector, has seen its valuation parameters shift notably, with its price-to-earnings (P/E) ratio moving into expensive territory at 38.7 times earnings. This re-rating comes amid deteriorating returns and a challenging market backdrop, raising questions about the stock’s price attractiveness relative to its historical levels and peer group.
Read More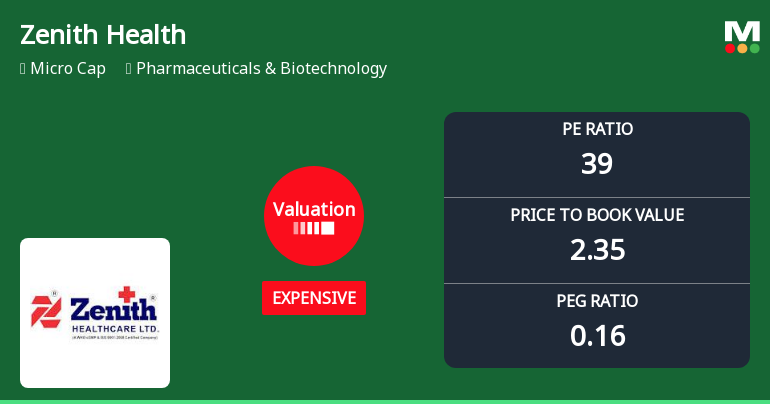
Zenith Health Care Ltd Valuation Shifts Signal Price Attractiveness Concerns
Zenith Health Care Ltd, a micro-cap player in the Pharmaceuticals & Biotechnology sector, has seen its valuation parameters shift notably, raising questions about its price attractiveness. The company’s price-to-earnings (P/E) ratio has surged to 39.29, marking a transition from fair to expensive valuation territory, while its price-to-book value (P/BV) stands at 2.35. These changes come amid a mixed performance backdrop and a recent upgrade in its MarketsMOJO grade from Strong Sell to Sell, reflecting nuanced investor sentiment.
Read More Announcements
Announcement under Regulation 30 (LODR)-Newspaper Publication
30-May-2026 | Source : BSEPaper Cuttings of Published Audited Financial Result for the Quarter and year ended 31st March 2026
Standalone Audited Financial Result For The Quarter And Year Ended On 31.03.2026
29-May-2026 | Source : BSEStandalone Audited Financial Result for the Quarter and Year ended on 31.03.2026
Board Meeting Outcome for Outcome Of Board Meeting
29-May-2026 | Source : BSEOutcome of Board Meeting held on 29th May 2026 for Consideration and Approval Audited Financial Result for the Quarter and Year ended 31st March 2026 and other matters
Corporate Actions

No Upcoming Board Meetings

No Dividend history available

No Splits history available

No Bonus history available

No Rights history available
Quality key factors
Valuation key factors
Technicals key factors
 Technical Indicator Scale: Bearish, Mildly Bearish, Sideways, Mildly Bullish, Bullish Turned
 Shareholding Snapshot : Mar 2026
Shareholding Compare (%holding)
Non Institution
None
Held by 1 Schemes (0.39%)
Held by 0 FIIs
Mahendra Chatrabhuj Raycha (12.29%)
Sharpline Trading Co. Pvt. Ltd. (3.29%)
63.94%
Quarterly Results Snapshot (Standalone) - Mar'26 - QoQ

QoQ Growth in quarter ended Mar 2026 is 5.65% vs 9.25% in Dec 2025
QoQ Growth in quarter ended Mar 2026 is -254.55% vs 57.14% in Dec 2025
Half Yearly Results Snapshot (Standalone) - Sep'25

Growth in half year ended Sep 2025 is -3.21% vs -25.43% in Sep 2024
Growth in half year ended Sep 2025 is -52.00% vs -30.56% in Sep 2024
Nine Monthly Results Snapshot (Standalone) - Dec'25
YoY Growth in nine months ended Dec 2025 is -0.13% vs -30.61% in Dec 2024
YoY Growth in nine months ended Dec 2025 is 950.00% vs -108.70% in Dec 2024
Annual Results Snapshot (Standalone) - Mar'26
YoY Growth in year ended Mar 2026 is -7.15% vs -21.70% in Mar 2025
YoY Growth in year ended Mar 2026 is -85.71% vs -65.00% in Mar 2025
About Zenith Health Care Ltd


