Dashboard
Poor long term growth as Operating profit has grown by an annual rate -14.74% of over the last 5 years
The company has declared Negative results for the last 6 consecutive quarters
Technical trend is Sideways signifying no clear price momentum
With ROCE of 6.3, it has a Expensive valuation with a 2.4 Enterprise value to Capital Employed
Increasing Participation by Institutional Investors
Stock DNA
Garments & Apparels
INR 14,502 Cr (Small Cap)
68.00
24
1.15%
0.39
7.32%
2.87
Total Returns (Price + Dividend) 
Latest dividend: 1.7 per share ex-dividend date: Jun-27-2025
Risk Adjusted Returns v/s
Returns Beta

News

Welspun Living Ltd Sees Technical Momentum Shift Amid Mixed Market Signals
Welspun Living Ltd, a small-cap player in the Garments & Apparels sector, has exhibited a notable shift in its technical momentum, moving from a mildly bearish stance to a sideways trend. Despite a modest day gain of 1.23%, the stock’s technical indicators present a complex picture, with bullish and bearish signals interwoven across weekly and monthly timeframes.
Read More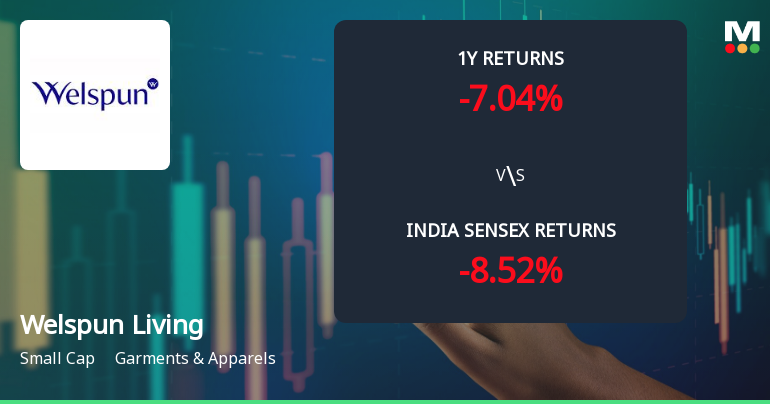
Welspun Living Ltd Technical Momentum Shifts Amid Mixed Market Signals
Welspun Living Ltd, a small-cap player in the Garments & Apparels sector, has experienced a subtle shift in its technical momentum, moving from a sideways trend to a mildly bearish stance. Despite a recent downgrade in its Mojo Grade from Strong Sell to Sell, the stock’s technical indicators present a complex picture, with bullish signals on some timeframes and bearish cues on others, reflecting a nuanced market sentiment as the price hovers near ₹138.60.
Read More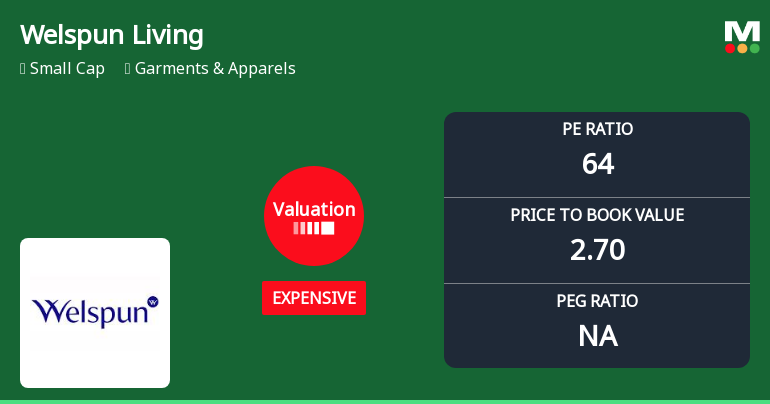
Welspun Living Ltd Valuation Shifts Signal Price Attractiveness Concerns
Welspun Living Ltd, a small-cap player in the Garments & Apparels sector, has witnessed a notable shift in its valuation parameters, moving from fair to expensive territory. Despite recent positive returns relative to the Sensex, the company’s elevated price-to-earnings (P/E) and price-to-book value (P/BV) ratios raise questions about its current price attractiveness compared to historical and peer benchmarks.
Read More Announcements
Disclosure Under Regulation 30 Of The SEBI (Listing Obligations And Disclosure Requirements) Regulations 2015 For Commencement Of Commercial Production In The Pillow Manufacturing Unit At Nevada USA
16-Jun-2026 | Source : BSEPlease find attached herewith intimation regarding full commencement of commercial production in the pillow manufacturing unit at Nevada USA.
Disclosures under Reg. 29(2) of SEBI (SAST) Regulations 2011
15-Jun-2026 | Source : BSEThe Exchange has received the disclosure under Regulation 29(2) of SEBI (Substantial Acquisition of Shares & Takeovers) Regulations 2011 for Balkrishan Goenka & Other
Announcement under Regulation 30 (LODR)-Post Buyback Public Announcement
12-Jun-2026 | Source : BSEPost Buy-back Public Announcement dated June 11 2026 published in newspaper(s) on June 12 2026 is attached herewith for your records.
Corporate Actions

No Upcoming Board Meetings

Welspun Living Ltd has declared 10% dividend, ex-date: 10 Jul 26

Welspun Living Ltd has announced 1:10 stock split, ex-date: 21 Mar 16

No Bonus history available

No Rights history available
Quality key factors
Valuation key factors
Technicals key factors
 Technical Indicator Scale: Bearish, Mildly Bearish, Sideways, Mildly Bullish, Bullish Turned
 Shareholding Snapshot : Mar 2026
Shareholding Compare (%holding)
Promoters
None
Held by 22 Schemes (4.84%)
Held by 110 FIIs (4.99%)
Balkrishan Goenka Trustee Of Welspun Group Master Trust (65.73%)
Sbi Life Insurance Co.ltd (3.54%)
11.96%
Quarterly Results Snapshot (Consolidated) - Dec'25 - QoQ

QoQ Growth in quarter ended Dec 2025 is -7.32% vs 7.98% in Sep 2025
QoQ Growth in quarter ended Dec 2025 is -98.38% vs -85.17% in Sep 2025
Half Yearly Results Snapshot (Consolidated) - Sep'25
Growth in half year ended Sep 2025 is -13.09% vs 15.27% in Sep 2024
Growth in half year ended Sep 2025 is -73.99% vs 7.87% in Sep 2024
Nine Monthly Results Snapshot (Consolidated) - Dec'25
YoY Growth in nine months ended Dec 2025 is -11.84% vs 11.19% in Dec 2024
YoY Growth in nine months ended Dec 2025 is -80.14% vs -5.19% in Dec 2024
Annual Results Snapshot (Consolidated) - Mar'25
YoY Growth in year ended Mar 2025 is 8.95% vs 19.59% in Mar 2024
YoY Growth in year ended Mar 2025 is -6.16% vs 242.55% in Mar 2024
About Welspun Living Ltd


