Dashboard
Low ability to service debt as the company has a high Debt to EBITDA ratio of 16.82 times
- Poor long term growth as Operating profit has grown by an annual rate 25.45% of over the last 5 years
- Low ability to service debt as the company has a high Debt to EBITDA ratio of 16.82 times
- The company has been able to generate a Return on Equity (avg) of 12.86% signifying low profitability per unit of shareholders funds
The company has declared Negative results for the last 6 consecutive quarters
Stock is technically in a Bearish range
With ROCE of 2.1, it has a Very Expensive valuation with a 1.3 Enterprise value to Capital Employed
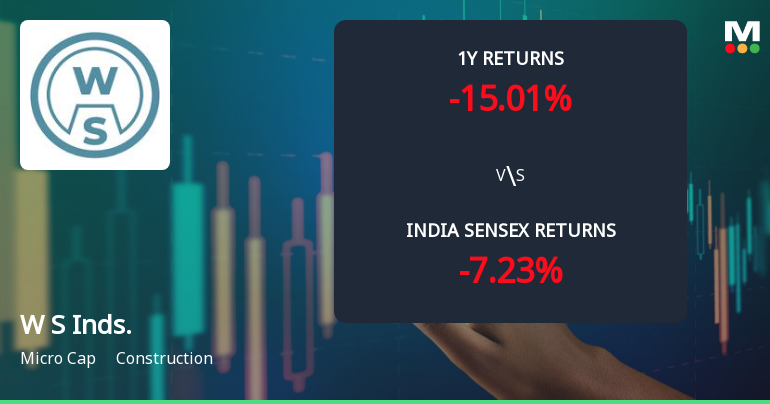
Total Returns (Price + Dividend) 
Latest dividend: 1.0000 per share ex-dividend date: Sep-03-2009
Risk Adjusted Returns v/s
Returns Beta

News
W S Industries (India) Ltd Faces Bearish Momentum Amid Technical Indicator Shifts
W S Industries (India) Ltd, a micro-cap player in the construction sector, has experienced a notable shift in its technical momentum, moving from a mildly bearish to a more pronounced bearish trend. Recent technical indicators, including MACD, RSI, and moving averages, signal a challenging outlook for the stock, which has underperformed the broader market benchmarks over multiple time horizons.
Read More
W S Industries (India) Ltd Shows Mixed Technical Signals Amid Mild Momentum Shift
W S Industries (India) Ltd has exhibited a nuanced shift in its technical momentum, moving from a strongly bearish stance to a mildly bearish trend, reflecting a complex interplay of technical indicators. Despite a modest day gain of 2.24%, the stock remains under pressure with a Mojo Grade of Sell, signalling caution for investors amid mixed signals from MACD, RSI, and moving averages.
Read More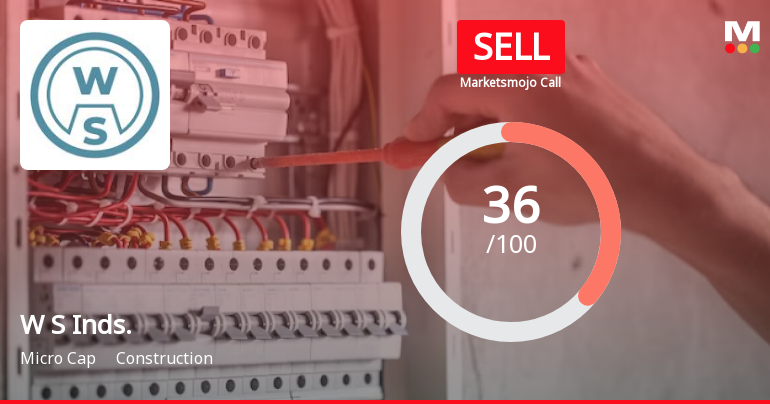
W S Industries (India) Ltd is Rated Sell
W S Industries (India) Ltd is rated 'Sell' by MarketsMOJO, with this rating last updated on 15 May 2026. However, the analysis and financial metrics discussed here reflect the company’s current position as of 19 May 2026, providing investors with the most recent insights into its performance and outlook.
Read More Announcements
Announcement Under Regulation 30
03-Jun-2026 | Source : BSEUpdate under Regulation 30(7) of SEBI (LODR) Regulations
Announcement Under Regulation 30
26-May-2026 | Source : BSEOutcome of Board Meeting held on 26.05.2026.
Update To The Disclosure Being Made Under Reg 30 Of SEBI LODR In Continuation Of Earlier Disclosure Dated 29.04.2026 And 30.04.2026
19-May-2026 | Source : BSEUpdate to the disclosure being made under Reg.30 of SEBI LODR in continuation of the earlier disclosure dated 29.04.2026 and 30.04.2026 relating to examination of trading transactions under SEBI PIT Regulations
Corporate Actions

No Upcoming Board Meetings

W S Industries (India) Ltd has declared 10% dividend, ex-date: 03 Sep 09

No Splits history available

No Bonus history available

No Rights history available
Quality key factors
Valuation key factors
Technicals key factors
 Technical Indicator Scale: Bearish, Mildly Bearish, Sideways, Mildly Bullish, Bullish Turned
 Shareholding Snapshot : Mar 2026
Shareholding Compare (%holding)
Promoters
2.1506
Held by 2 Schemes (0.0%)
Held by 4 FIIs (13.69%)
Seyyadurai Nagarajan (11.74%)
Vikasa India Eif I Fund (6.59%)
26.51%
Quarterly Results Snapshot (Consolidated) - Dec'25 - QoQ

QoQ Growth in quarter ended Dec 2025 is -14.47% vs -7.68% in Sep 2025
QoQ Growth in quarter ended Dec 2025 is -565.85% vs -71.53% in Sep 2025
Half Yearly Results Snapshot (Consolidated) - Sep'25
Growth in half year ended Sep 2025 is -62.55% vs 5.45% in Sep 2024
Growth in half year ended Sep 2025 is -75.56% vs -53.84% in Sep 2024
Nine Monthly Results Snapshot (Consolidated) - Dec'25
YoY Growth in nine months ended Dec 2025 is -64.55% vs -15.97% in Dec 2024

YoY Growth in nine months ended Dec 2025 is 99.63% vs -153.02% in Dec 2024
Annual Results Snapshot (Consolidated) - Mar'25
YoY Growth in year ended Mar 2025 is -26.76% vs 309.66% in Mar 2024
YoY Growth in year ended Mar 2025 is -137.45% vs 139.00% in Mar 2024
About W S Industries (India) Ltd


