Dashboard
Weak Long Term Fundamental Strength with an average Return on Capital Employed (ROCE) of 0.01%
- Poor long term growth as Operating profit has grown by an annual rate 32.34% of over the last 5 years
- Low ability to service debt as the company has a high Debt to EBITDA ratio of 5.94 times
With ROCE of -10.2, it has a Very Expensive valuation with a 2.2 Enterprise value to Capital Employed
30.45% of Promoter Shares are Pledged
Stock DNA
Other Consumer Services
INR 2,275 Cr (Small Cap)
68.00
156
0.00%
0.39
-20.90%
2.36
Total Returns (Price + Dividend) 
Veranda Learning for the last several years.
Risk Adjusted Returns v/s
Returns Beta

News
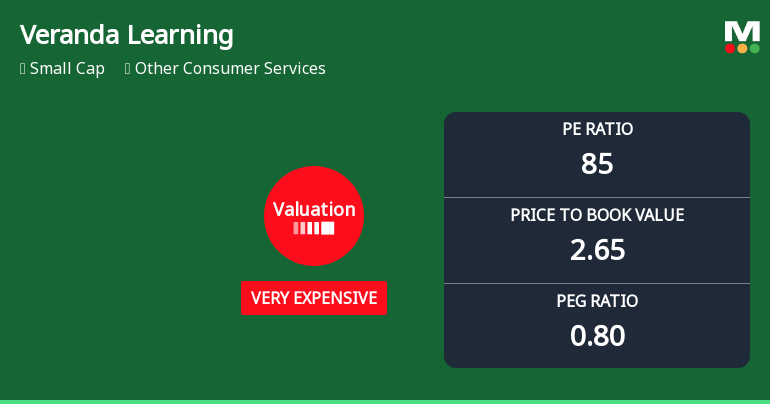
Veranda Learning Solutions Ltd: Valuation Shifts Signal Price Attractiveness Challenges
Veranda Learning Solutions Ltd has experienced a notable shift in its valuation parameters, moving from an already expensive status to very expensive territory. Despite recent strong returns relative to the Sensex, the company’s elevated price-to-earnings (P/E) and price-to-book value (P/BV) ratios, combined with negative profitability metrics, raise concerns about the stock’s price attractiveness and risk profile.
Read More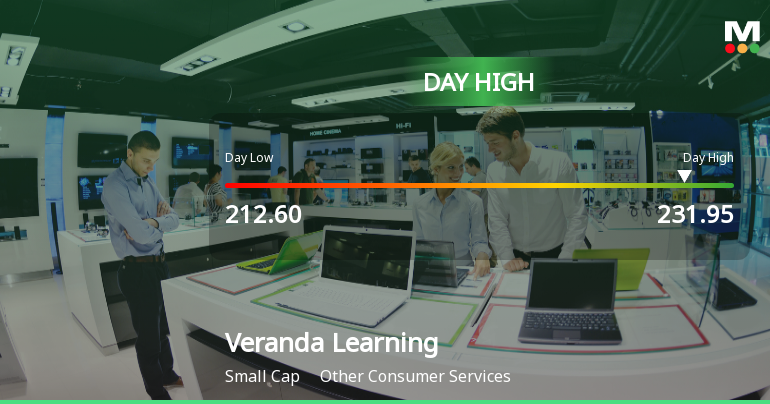
Veranda Learning Solutions Ltd Surges 7.83% to Day's High of Rs 231.95 — Outperforms Sector by 7.59 Percentage Points
The Sensex eked out a modest gain of 0.17% on 13 May 2026, but Veranda Learning Solutions Ltd surged 7.83%, outperforming its sector by 7.59 percentage points. This sharp single-session advance rewrites the short-term narrative for the small-cap stock, raising the question of whether this is a genuine breakout or a technical bounce within a broader trend.
Read More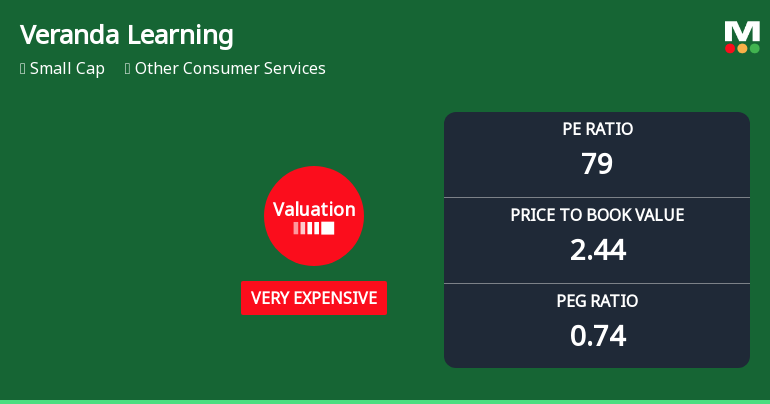
Veranda Learning Solutions Ltd: Valuation Shifts Signal Heightened Price Risk
Veranda Learning Solutions Ltd, a small-cap player in the Other Consumer Services sector, has seen its valuation metrics shift markedly, raising concerns about price attractiveness amid deteriorating fundamentals. The company’s price-to-earnings (P/E) ratio has surged to 78.64, pushing its valuation grade from expensive to very expensive, while key profitability indicators remain negative. This article analyses the implications of these valuation changes in the context of historical trends, peer comparisons, and broader market performance.
Read More Announcements
Announcement under Regulation 30 (LODR)-Newspaper Publication
15-Jun-2026 | Source : BSEPlease find the enclosed disclosure.
Announcement under Regulation 30 (LODR)-Press Release / Media Release
10-Jun-2026 | Source : BSEPlease find the attached disclosure.
Announcement under Regulation 30 (LODR)-Earnings Call Transcript
01-Jun-2026 | Source : BSEPlease find the enclosed disclosure.
Corporate Actions

No Upcoming Board Meetings

No Dividend history available

No Splits history available

No Bonus history available

No Rights history available
Quality key factors
Valuation key factors
Technicals key factors
 Technical Indicator Scale: Bearish, Mildly Bearish, Sideways, Mildly Bullish, Bullish Turned
 Shareholding Snapshot : Mar 2026
Shareholding Compare (%holding)
Non Institution
30.4542
Held by 1 Schemes (0.0%)
Held by 19 FIIs (2.37%)
Kalpathi S Aghoram (10.64%)
Authum Investment And Infrastructure Limited (13.8%)
37.76%
Quarterly Results Snapshot (Consolidated) - Mar'26 - QoQ

QoQ Growth in quarter ended Mar 2026 is 13.35% vs -7.84% in Dec 2025
QoQ Growth in quarter ended Mar 2026 is -14.66% vs -89.18% in Dec 2025
Half Yearly Results Snapshot (Consolidated) - Sep'25
Growth in half year ended Sep 2025 is 20.16% vs 15.63% in Sep 2024
Growth in half year ended Sep 2025 is 259.59% vs -178.26% in Sep 2024
Nine Monthly Results Snapshot (Consolidated) - Dec'25
YoY Growth in nine months ended Dec 2025 is 19.36% vs 12.91% in Dec 2024
YoY Growth in nine months ended Dec 2025 is 141.65% vs -555.01% in Dec 2024
Annual Results Snapshot (Consolidated) - Mar'26
YoY Growth in year ended Mar 2026 is 34.60% vs -1.11% in Mar 2025
YoY Growth in year ended Mar 2026 is 142.66% vs -210.32% in Mar 2025
About Veranda Learning Solutions Ltd

Company Coordinates