Dashboard
With a Operating Losses, the company has a Weak Long Term Fundamental Strength
- Poor long term growth as Operating profit has grown by an annual rate -231.44% of over the last 5 years
- Low ability to service debt as the company has a high Debt to EBITDA ratio of -1.00 times
Flat results in Dec 25
Stock is technically in a Bearish range
Risky - Negative EBITDA
Consistent Underperformance against the benchmark over the last 3 years
Stock DNA
Commodity Chemicals
INR 25 Cr (Micro Cap)
NA (Loss Making)
19
0.00%
1.76
-209.38%
6.72
Total Returns (Price + Dividend) 
Venlon Enterpris for the last several years.
Risk Adjusted Returns v/s
Returns Beta

News
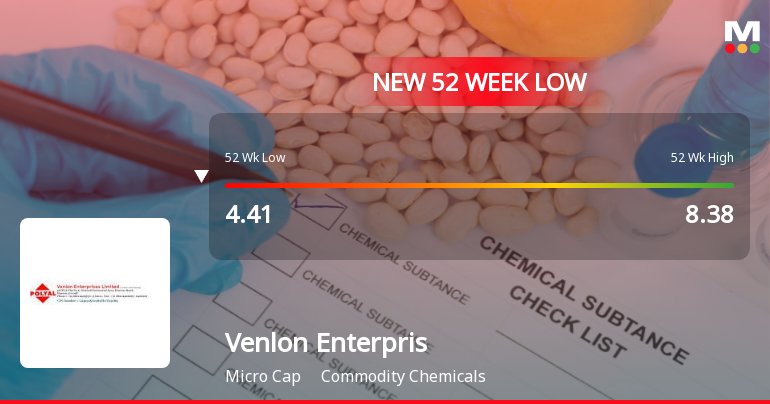
Venlon Enterprises Ltd Stock Falls to 52-Week Low of Rs.4.22
Venlon Enterprises Ltd, a micro-cap player in the commodity chemicals sector, has touched a new 52-week low of Rs.4.22 today, marking a significant decline amid ongoing pressures. The stock has underperformed its sector and broader market indices, reflecting persistent challenges in its financial and market performance.
Read More Announcements
Results_ Financials Results_31St March 2026
30-May-2026 | Source : BSEWe hereby submit the Audited Financial Results of the Company for the quarter and year ended 31st March 2026
Board Meeting Outcome for Outcome Of The Board Meeting Held On 30Th May 2026
30-May-2026 | Source : BSEWe hereby submit the Outcome of the Board Meeting held on 30th May 2026 considered the audited financial results for the quarter and year ended 31st March 2026.
Board Meeting Intimation for Consideration And Approval Of Financial Results For The Year Ended 31St March 2026
25-May-2026 | Source : BSEVenlon Enterprises Ltdhas informed BSE that the meeting of the Board of Directors of the Company is scheduled on 30/05/2026 inter alia to consider and approve the financial results for the year ended 31st March 2026
Corporate Actions

No Upcoming Board Meetings

No Dividend history available

No Splits history available

No Bonus history available

No Rights history available
Quality key factors
Valuation key factors
Technicals key factors
 Technical Indicator Scale: Bearish, Mildly Bearish, Sideways, Mildly Bullish, Bullish Turned
 Shareholding Snapshot : Mar 2026
Shareholding Compare (%holding)
Promoters
None
Held by 1 Schemes (0.01%)
Held by 0 FIIs
Dasu Daulatram Datwani (29.13%)
Krishna Enterprises Limited (29.43%)
9.68%
Quarterly Results Snapshot (Standalone) - Mar'26 - QoQ

QoQ Growth in quarter ended Mar 2026 is 91.54% vs -48.82% in Dec 2025

QoQ Growth in quarter ended Mar 2026 is -75.71% vs -52.17% in Dec 2025
Half Yearly Results Snapshot (Standalone) - Sep'25
Growth in half year ended Sep 2025 is -24.27% vs 28.94% in Sep 2024
Growth in half year ended Sep 2025 is -42.16% vs -155.00% in Sep 2024
Nine Monthly Results Snapshot (Standalone) - Dec'25
YoY Growth in nine months ended Dec 2025 is -36.03% vs 46.64% in Dec 2024
YoY Growth in nine months ended Dec 2025 is -47.26% vs -56.99% in Dec 2024
Annual Results Snapshot (Standalone) - Mar'26
YoY Growth in year ended Mar 2026 is -31.08% vs 32.41% in Mar 2025
YoY Growth in year ended Mar 2026 is 74.36% vs -929.69% in Mar 2025
About Venlon Enterprises Ltd


