Dashboard
High Management Efficiency with a high ROE of 14.16%
Company has a low Debt to Equity ratio (avg) at 0.10 times
Positive results in Mar 26
Stock is technically in a Bearish range
With ROE of 13.7, it has a Attractive valuation with a 5.6 Price to Book Value
High Institutional Holdings at 35.46%
Below par performance in long term as well as near term
Stock DNA
Electronics & Appliances
INR 13,404 Cr (Small Cap)
41.00
47
0.49%
0.02
13.26%
5.62
Total Returns (Price + Dividend) 
Latest dividend: 1.5 per share ex-dividend date: Jul-31-2025
Risk Adjusted Returns v/s
Returns Beta

News
Are V-Guard Industries Ltd latest results good or bad?
V-Guard Industries Ltd has reported its financial results for the fourth quarter of FY26, showcasing a notable performance characterized by significant growth in both net profit and revenue. The company achieved a net profit of ₹112.14 crores, reflecting a substantial sequential increase of 96.51% compared to the previous quarter, and a year-on-year growth of 23.04%. This performance indicates a recovery from prior quarters, where profit had declined. Revenue for the same quarter reached ₹1,755.27 crores, marking a sequential growth of 25.06% and a year-on-year increase of 14.12%. This revenue surge is attributed to seasonal demand and improved operational efficiency, with the company achieving its highest quarterly sales in recent history. The operating margin also expanded to 9.73%, the highest in twelve quarters, suggesting effective cost management and pricing power despite inflationary pressures. Whi...
Read More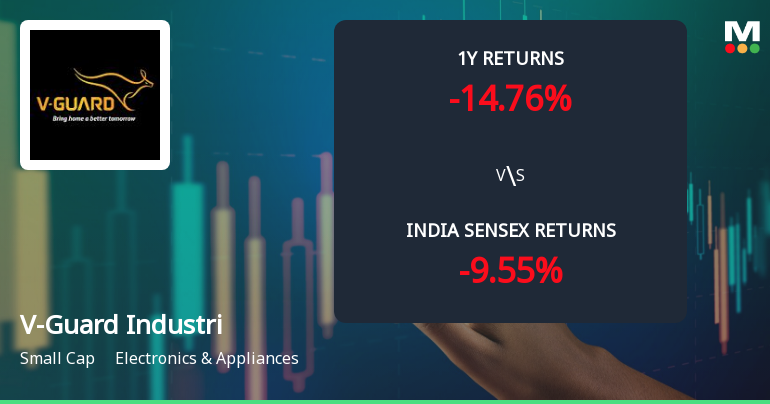
V-Guard Industries Ltd Faces Bearish Momentum Amid Technical Downgrade
V-Guard Industries Ltd, a small-cap player in the Electronics & Appliances sector, has experienced a notable shift in its technical momentum, with key indicators signalling a bearish trend. The stock’s recent downgrade from a Hold to a Sell rating reflects deteriorating market sentiment, as price action and technical parameters suggest increasing downside risks.
Read More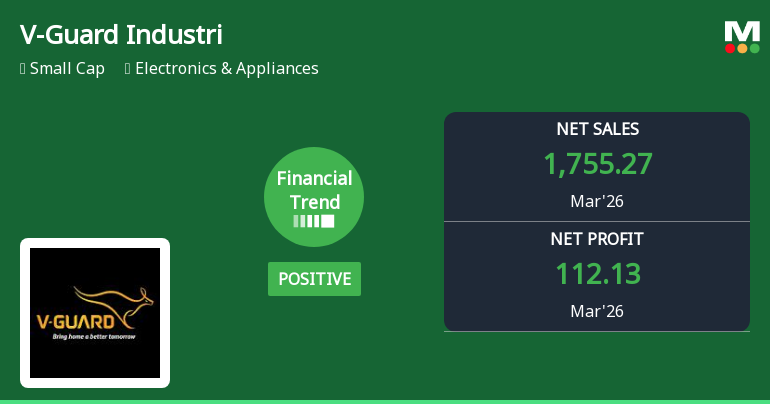
V-Guard Industries Ltd Reports Strong Quarterly Financial Turnaround Amid Market Challenges
V-Guard Industries Ltd has delivered its strongest quarterly performance to date in March 2026, registering record net sales and profit metrics that mark a significant turnaround from previous quarters. Despite a challenging market environment and a recent downgrade in its Mojo Grade to Sell, the company’s financial trend has shifted positively, signalling renewed operational strength and margin expansion.
Read More Announcements
Announcement under Regulation 30 (LODR)-Analyst / Investor Meet - Intimation
12-Jun-2026 | Source : BSEIntimation of analyst/investor meet
Compliances-Reg.24(A)-Annual Secretarial Compliance
22-May-2026 | Source : BSEAnnual Secretarial compliance Report for the year ended March 31 2026.
Announcement under Regulation 30 (LODR)-Newspaper Publication
20-May-2026 | Source : BSEKindly find attached Newspaper publication regarding transfer of equity shares to IEPFA
Corporate Actions

No Upcoming Board Meetings

V-Guard Industries Ltd has declared 150% dividend, ex-date: 31 Jul 26

V-Guard Industries Ltd has announced 1:10 stock split, ex-date: 30 Aug 16

V-Guard Industries Ltd has announced 2:5 bonus issue, ex-date: 15 Mar 17

No Rights history available
Quality key factors
Valuation key factors
Technicals key factors
 Technical Indicator Scale: Bearish, Mildly Bearish, Sideways, Mildly Bullish, Bullish Turned
 Shareholding Snapshot : Mar 2026
Shareholding Compare (%holding)
Promoters
None
Held by 15 Schemes (23.35%)
Held by 121 FIIs (12.07%)
Mithun Kochouseph Chittilappilly (19.8%)
Sbi Small Cap Fund (7.36%)
9.45%
Quarterly Results Snapshot (Consolidated) - Mar'26 - QoQ

QoQ Growth in quarter ended Mar 2026 is 25.06% vs 4.67% in Dec 2025
QoQ Growth in quarter ended Mar 2026 is 96.51% vs -12.61% in Dec 2025
Half Yearly Results Snapshot (Consolidated) - Sep'25

Growth in half year ended Sep 2025 is 1.30% vs 17.99% in Sep 2024
Growth in half year ended Sep 2025 is -14.30% vs 31.82% in Sep 2024
Nine Monthly Results Snapshot (Consolidated) - Dec'25
YoY Growth in nine months ended Dec 2025 is 4.23% vs 14.96% in Dec 2024
YoY Growth in nine months ended Dec 2025 is -11.85% vs 22.69% in Dec 2024
Annual Results Snapshot (Consolidated) - Mar'26
YoY Growth in year ended Mar 2026 is 6.96% vs 14.85% in Mar 2025
YoY Growth in year ended Mar 2026 is -1.72% vs 21.80% in Mar 2025
About V-Guard Industries Ltd


