Dashboard
Weak Long Term Fundamental Strength with an average Return on Capital Employed (ROCE) of 5.98%
- Poor long term growth as Net Sales has grown by an annual rate of 14.28% and Operating profit at 16.87% over the last 5 years
- Low ability to service debt as the company has a high Debt to EBITDA ratio of 5.38 times
Stock is technically in a Mildly Bearish range
Underperformed the market in the last 1 year
Stock DNA
Garments & Apparels
INR 15 Cr (Micro Cap)
NA (Loss Making)
24
0.00%
0.84
-2.83%
0.80
Total Returns (Price + Dividend) 
Uniroyal Ind for the last several years.
Risk Adjusted Returns v/s
Returns Beta

News
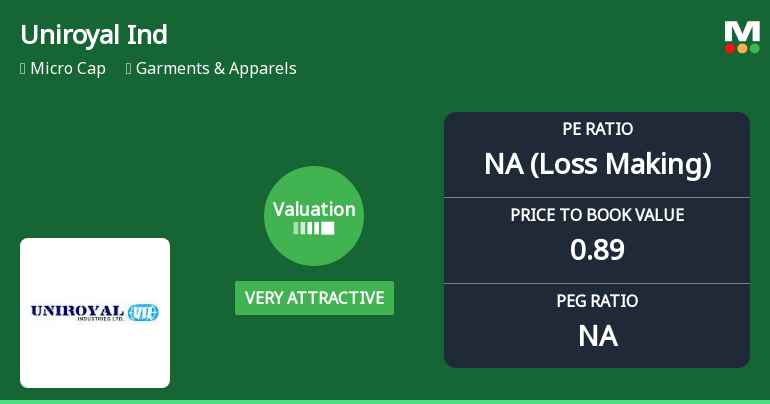
Uniroyal Industries Ltd Valuation Shifts to Very Attractive Amid Mixed Financials
Uniroyal Industries Ltd, a micro-cap player in the Garments & Apparels sector, has witnessed a significant shift in its valuation parameters, moving from an attractive to a very attractive price level. Despite a recent day decline of 4.65%, the stock’s price-to-earnings (P/E) ratio and price-to-book value (P/BV) metrics suggest a compelling entry point relative to its historical averages and peer group, warranting a closer examination of its market positioning and financial health.
Read More
Uniroyal Industries Ltd: Valuation Shift Signals Renewed Price Attractiveness Amid Mixed Fundamentals
Uniroyal Industries Ltd has witnessed a notable shift in its valuation parameters, moving from a very attractive to an attractive rating, reflecting a nuanced change in price attractiveness despite ongoing challenges in profitability and returns. This article analyses the recent valuation changes, compares them with peer benchmarks, and assesses the implications for investors amid the company’s mixed financial performance and market returns.
Read More Announcements
Announcement under Regulation 30 (LODR)-Newspaper Publication
30-May-2026 | Source : BSEPublication is attached
Results For The Year Ended 31.03.2026 Styandalone & Consolidated
29-May-2026 | Source : BSEAbove Subject results are attached herewith
Board Meeting Outcome for Audited Results 31.03.2026 Standalone & Consolidated
29-May-2026 | Source : BSEAudited Results Standalone & Consolidated for the year ended 31.03.2026 are approved by the Board of Directors
Corporate Actions

No Upcoming Board Meetings

No Dividend history available

No Splits history available

No Bonus history available

No Rights history available
Quality key factors
Valuation key factors
Technicals key factors
 Technical Indicator Scale: Bearish, Mildly Bearish, Sideways, Mildly Bullish, Bullish Turned
 Shareholding Snapshot : Mar 2026
Shareholding Compare (%holding)
Promoters
None
Held by 2 Schemes (0.05%)
Held by 0 FIIs
Akhil Mahajan (52.27%)
Raj Kumar Lohia (1.21%)
37.58%
Quarterly Results Snapshot (Consolidated) - Mar'26 - QoQ

QoQ Growth in quarter ended Mar 2026 is 0.53% vs -4.17% in Dec 2025

QoQ Growth in quarter ended Mar 2026 is -153.85% vs 657.14% in Dec 2025
Half Yearly Results Snapshot (Consolidated) - Sep'25
Growth in half year ended Sep 2025 is -7.86% vs 18.52% in Sep 2024
Growth in half year ended Sep 2025 is -833.33% vs 109.76% in Sep 2024
Nine Monthly Results Snapshot (Consolidated) - Dec'25
YoY Growth in nine months ended Dec 2025 is -2.97% vs 15.24% in Dec 2024
YoY Growth in nine months ended Dec 2025 is -296.00% vs -16.67% in Dec 2024
Annual Results Snapshot (Consolidated) - Mar'26
YoY Growth in year ended Mar 2026 is -2.51% vs 15.81% in Mar 2025
YoY Growth in year ended Mar 2026 is -252.17% vs -46.51% in Mar 2025
About Uniroyal Industries Ltd


