Dashboard
- PAT(Q) At Rs 5.47 cr has Fallen at -36.9% (vs previous 4Q average)
- NET SALES(Q) At Rs 45.53 cr has Fallen at -7.8% (vs previous 4Q average)
- PBDIT(Q) Lowest at Rs 5.78 cr.
With ROE of 24.6, it has a Expensive valuation with a 5.1 Price to Book Value
Despite the size of the company, domestic mutual funds hold only 0% of the company
Stock DNA
Iron & Steel Products
INR 852 Cr (Micro Cap)
19.00
47
0.81%
-0.37
24.50%
2.05
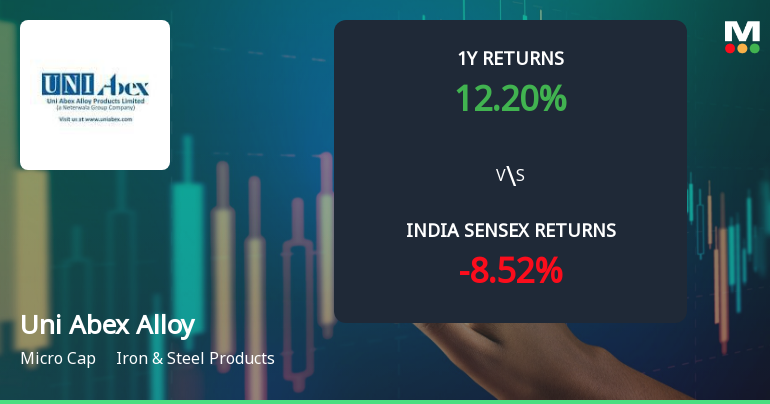
Total Returns (Price + Dividend) 
Latest dividend: 35 per share ex-dividend date: Sep-04-2025
Risk Adjusted Returns v/s
Returns Beta

News
Uni Abex Alloy Products Ltd Shows Signs of Technical Momentum Shift Amid Mixed Indicator Signals
Uni Abex Alloy Products Ltd, a micro-cap player in the Iron & Steel Products sector, has exhibited a notable shift in price momentum, transitioning from a sideways trend to a mildly bullish stance. Despite a modest day gain of 1.66%, the stock’s technical indicators present a nuanced picture, reflecting both optimism and caution among investors.
Read More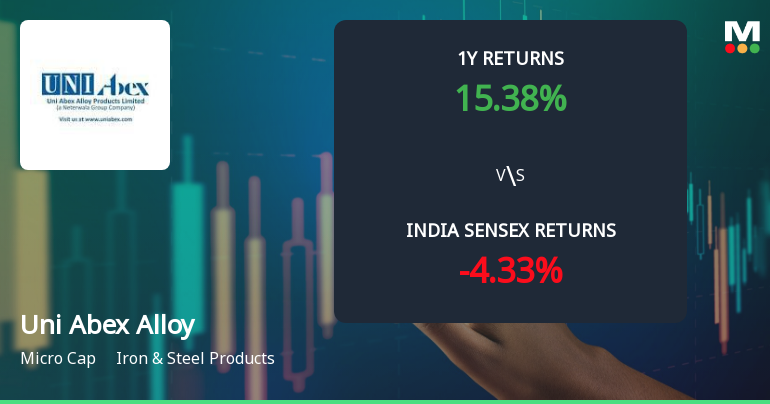
Uni Abex Alloy Products Ltd Technical Momentum Shifts Amid Mixed Indicator Signals
Uni Abex Alloy Products Ltd, a micro-cap player in the Iron & Steel Products sector, has experienced a notable shift in its technical momentum, reflecting a complex interplay of bullish and bearish signals across multiple timeframes. Despite a recent downgrade in its Mojo Grade to 'Sell' from 'Strong Sell', the stock's price action and technical indicators reveal a nuanced picture that investors should carefully analyse.
Read More
Uni Abex Alloy Products Ltd Shows Technical Momentum Shift Amid Mixed Indicator Signals
Uni Abex Alloy Products Ltd, a micro-cap player in the Iron & Steel Products sector, has exhibited a notable shift in its technical momentum, moving from a sideways trend to a mildly bullish stance. Despite a mixed bag of technical signals, the stock’s recent price action and indicator readings suggest cautious optimism for investors seeking opportunities in this segment.
Read More Announcements
Announcement under Regulation 30 (LODR)-Newspaper Publication
05-Jun-2026 | Source : BSEIntimation to the Equity Shareholders of the Company with respect to transfer of equity shares to Investor Education and Protection Fund (IEPF) and Saksham Niveshak Campaign - Regulation 30 of SEBI (Listing Obligation & Disclosure Requirements) Regulations 2015
Intimation To The Equity Shareholders Of The Company With Respect To Transfer Of Equity Shares To Investor Education And Protection Fund (IEPF) And Saksham Niveshak Campaign
04-Jun-2026 | Source : BSEIntimation to the Equity Shareholders of the Company with respect to transfer of equity shares to Investor Education and Protection Fund (IEPF) and Saksham Niveshak Campaign
Announcement under Regulation 30 (LODR)-Newspaper Publication
29-May-2026 | Source : BSENewspaper Advertisement(s) of Audited Financial Results of the Company for FY 2025-26
Corporate Actions

No Upcoming Board Meetings

Uni Abex Alloy Products Ltd has declared 350% dividend, ex-date: 04 Sep 25

No Splits history available

No Bonus history available

No Rights history available
Quality key factors
Valuation key factors
Technicals key factors
 Technical Indicator Scale: Bearish, Mildly Bearish, Sideways, Mildly Bullish, Bullish Turned
 Shareholding Snapshot : Mar 2026
Shareholding Compare (%holding)
Promoters
None
Held by 0 Schemes
Held by 0 FIIs
Unitel Finance And Investments Private Limited (41.39%)
Hitesh Satishchandra Doshi (2.54%)
28.47%
Quarterly Results Snapshot (Standalone) - Dec'25 - QoQ

QoQ Growth in quarter ended Dec 2025 is -18.38% vs 42.37% in Sep 2025
QoQ Growth in quarter ended Dec 2025 is -51.16% vs 101.44% in Sep 2025
Half Yearly Results Snapshot (Standalone) - Sep'25

Growth in half year ended Sep 2025 is 4.85% vs -11.41% in Sep 2024
Growth in half year ended Sep 2025 is 7.16% vs -27.49% in Sep 2024
Nine Monthly Results Snapshot (Standalone) - Dec'25
YoY Growth in nine months ended Dec 2025 is 5.92% vs -9.96% in Dec 2024
YoY Growth in nine months ended Dec 2025 is 6.21% vs -34.66% in Dec 2024
Annual Results Snapshot (Standalone) - Mar'25
YoY Growth in year ended Mar 2025 is 7.28% vs 10.40% in Mar 2024
YoY Growth in year ended Mar 2025 is -5.33% vs 91.37% in Mar 2024
About Uni Abex Alloy Products Ltd


