Stock DNA
Commercial Services & Supplies
INR 108 Cr ()
12.00
36
0.00%
0.00
0.00%
2.57
Total Returns (Price + Dividend) 
Telge Projects for the last several years.
Risk Adjusted Returns v/s
Returns Beta

News

Telge Projects Ltd Upgraded from Strong Sell to Sell on Improved Fundamentals and Valuation
Telge Projects Ltd, a micro-cap player in the Commercial Services & Supplies sector, has seen its investment rating upgraded from Strong Sell to Sell as of 20 May 2026. This revision reflects notable improvements across key parameters including quality, valuation, financial trends, and technical indicators, signalling a cautiously optimistic outlook despite lingering challenges.
Read MoreAre Telge Projects Ltd latest results good or bad?
Telge Projects Ltd's latest financial results for Q4 FY26 indicate a period of significant revenue and profit growth, reflecting a strong operational performance. The company reported a net profit of ₹3.29 crores, which represents a substantial year-on-year increase of 1,395.45%. Revenue for the quarter reached ₹14.39 crores, marking a year-on-year growth of 171.51% and a quarter-on-quarter increase of 58.48%. This notable revenue surge suggests robust demand in its commercial services operations and possibly successful contract execution. The operating margin for Q4 FY26 was reported at 33.98%, a considerable improvement from 13.96% in the same quarter last year. The PAT margin also saw a significant rise to 24.39% from 4.15% year-on-year, indicating enhanced profitability and operational leverage. However, the volatility in margins raises questions about consistency, as the operating margin has fluctuate...
Read More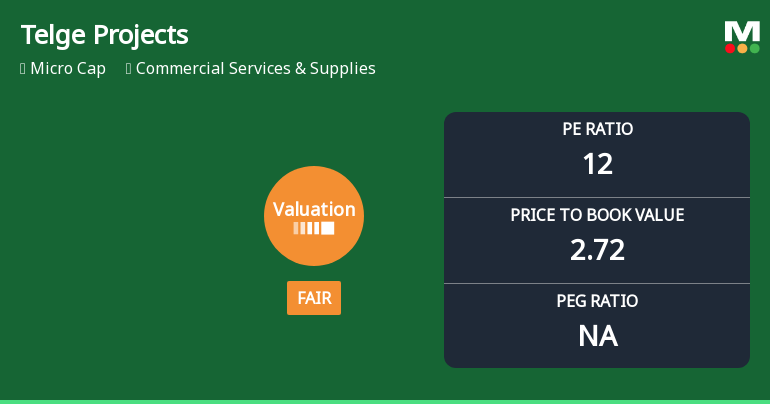
Telge Projects Ltd Valuation Shifts Signal Improved Price Attractiveness Amid Market Challenges
Telge Projects Ltd, a micro-cap player in the Commercial Services & Supplies sector, has seen a notable shift in its valuation parameters, moving from a previously very expensive rating to a fair valuation. This recalibration comes amid a backdrop of mixed market performance and evolving investor sentiment, prompting a reassessment of the stock’s price attractiveness relative to its peers and historical benchmarks.
Read More Announcements
Statement Of Deviation Or Variation For Half Year And Year Ended March 31 2026.
29-May-2026 | Source : BSEStatement of Deviation or Variation for half year and year ended March 31 2026.
Announcement under Regulation 30 (LODR)-Earnings Call Transcript
22-May-2026 | Source : BSEPursuant to Regulation 30 of SEBI (LODR) Regulations 2015 copy of transcript of earnings call held on May 19 2026 for Audited Financial Results for quarter and year ended March 31 2026 is enclosed.
Announcement under Regulation 30 (LODR)-Investor Presentation
19-May-2026 | Source : BSEInvestor Presentation for Financial Year ended March 31 2026.
Corporate Actions

No Upcoming Board Meetings

No Dividend history available

No Splits history available

No Bonus history available

No Rights history available
Quality key factors
Valuation key factors
Technicals key factors
 Technical Indicator Scale: Bearish, Mildly Bearish, Sideways, Mildly Bullish, Bullish Turned
 Shareholding Snapshot : Mar 2026
Shareholding Compare (%holding)
Promoters
None
Held by 0 Schemes
Held by 2 FIIs (1.74%)
Shraddha Shailesh Telge (71.5%)
Aarth Aif Growth Fund (2.76%)
13.98%
Quarterly Results Snapshot (Standalone) - Mar'26 - QoQ

QoQ Growth in quarter ended Mar 2026 is 14.53% vs 10.49% in Dec 2025

QoQ Growth in quarter ended Mar 2026 is 63.46% vs 100.00% in Dec 2025
Annual Results Snapshot (Standalone) - Mar'26
YoY Growth in year ended Mar 2026 is 21.86% vs 52.90% in Mar 2025
YoY Growth in year ended Mar 2026 is -29.77% vs 51.09% in Mar 2025


