Dashboard
With a Operating Losses, the company has a Weak Long Term Fundamental Strength
- Low ability to service debt as the company has a high Debt to EBITDA ratio of -1.00 times
- The company has been able to generate a Return on Equity (avg) of 0.32% signifying low profitability per unit of shareholders funds
Stock is technically in a Mildly Bearish range
Risky - Negative EBITDA
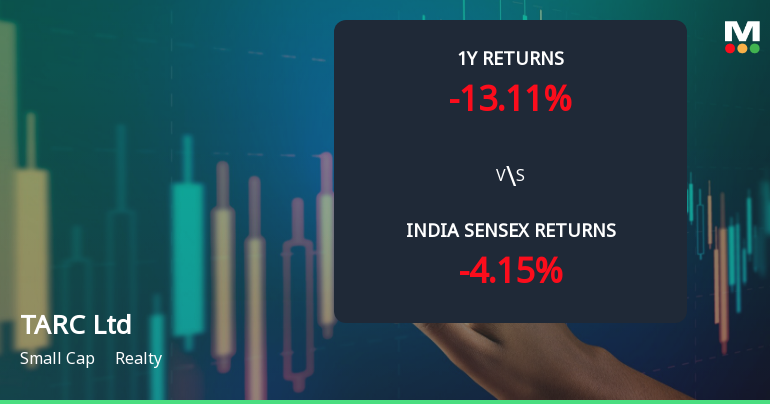
Underperformed the market in the last 1 year
Total Returns (Price + Dividend) 
TARC Ltd for the last several years.
Risk Adjusted Returns v/s
Returns Beta

News
TARC Ltd Technical Momentum Shifts Amid Bearish Signals
TARC Ltd, a small-cap player in the realty sector, has experienced a notable shift in its technical momentum, with key indicators signalling a bearish outlook. Despite a strong long-term return profile, recent price action and technical parameters suggest increasing downside risks, prompting a downgrade to a Strong Sell rating by MarketsMOJO as of 13 Jan 2026.
Read More
TARC Ltd is Rated Strong Sell
TARC Ltd is rated Strong Sell by MarketsMOJO, with this rating last updated on 13 January 2026. However, the analysis and financial metrics discussed here reflect the company’s current position as of 23 April 2026, providing investors with the latest insights into its performance and outlook.
Read More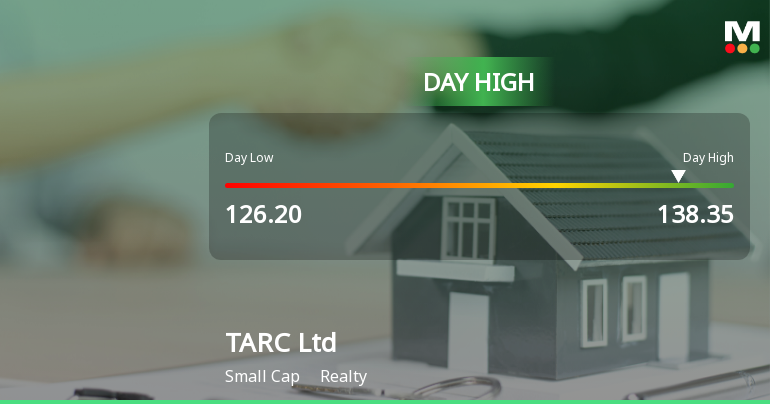
TARC Ltd Surges 8.23% to Day's High of Rs 138.35 — Outperforms Realty Sector by 7.57 Percentage Points
While the Sensex slipped 0.23% on 16 Apr 2026, TARC Ltd surged 8.23%, marking a 7.57-percentage-point outperformance over its Realty sector peers. This sharp single-session gain rewrites the short-term narrative for the stock, which has been on a two-day winning streak, raising the question of whether this is a genuine recovery or a technical bounce within a broader downtrend.
Read More Announcements
Announcement under Regulation 30 (LODR)-Newspaper Publication
31-May-2026 | Source : BSENewspaper Publication
Compliances-Reg.24(A)-Annual Secretarial Compliance
30-May-2026 | Source : BSEAnnual Secretarial Compliance Report for the financial year ended March 31 2026
Financial Results
29-May-2026 | Source : BSEFinancial Results
Corporate Actions

No Upcoming Board Meetings

No Dividend history available

No Splits history available

No Bonus history available

No Rights history available
Quality key factors
Valuation key factors
Technicals key factors
 Technical Indicator Scale: Bearish, Mildly Bearish, Sideways, Mildly Bullish, Bullish Turned
 Shareholding Snapshot : Mar 2026
Shareholding Compare (%holding)
Promoters
None
Held by 8 Schemes (6.39%)
Held by 45 FIIs (0.92%)
Anil Sarin (33.48%)
Bandhan Small Cap Fund (4.53%)
18.0%
Quarterly Results Snapshot (Consolidated) - Mar'26 - QoQ

QoQ Growth in quarter ended Mar 2026 is 443.77% vs 458.66% in Dec 2025

QoQ Growth in quarter ended Mar 2026 is 107.70% vs -33.44% in Dec 2025
Half Yearly Results Snapshot (Consolidated) - Sep'25
Growth in half year ended Sep 2025 is 560.57% vs -86.48% in Sep 2024
Growth in half year ended Sep 2025 is 139.26% vs -1,296.83% in Sep 2024
Nine Monthly Results Snapshot (Consolidated) - Dec'25
YoY Growth in nine months ended Dec 2025 is 453.70% vs -78.54% in Dec 2024
YoY Growth in nine months ended Dec 2025 is 113.77% vs -400.75% in Dec 2024
Annual Results Snapshot (Consolidated) - Mar'26
YoY Growth in year ended Mar 2026 is 879.04% vs -69.77% in Mar 2025
YoY Growth in year ended Mar 2026 is 108.25% vs -200.09% in Mar 2025
About TARC Ltd

Company Coordinates