Dashboard
Weak Long Term Fundamental Strength with an average Return on Capital Employed (ROCE) of 1.52%
- Poor long term growth as Net Sales has grown by an annual rate of 12.01% over the last 5 years
- Low ability to service debt as the company has a high Debt to EBITDA ratio of 6.78 times
Stock is technically in a Bearish range
Stock DNA
Iron & Steel Products
INR 12 Cr (Micro Cap)
206.00
91
0.00%
0.76
0.74%
1.31
Total Returns (Price + Dividend) 
T N Steel Tubes for the last several years.
Risk Adjusted Returns v/s
Returns Beta

News
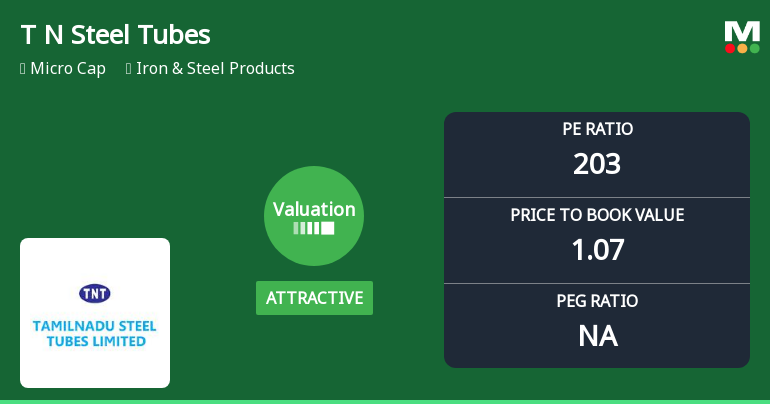
Tamilnadu Steel Tubes Ltd Valuation Shifts Signal Renewed Price Attractiveness
Tamilnadu Steel Tubes Ltd, a micro-cap player in the Iron & Steel Products sector, has witnessed a notable shift in its valuation parameters, moving from a risky to an attractive valuation grade despite ongoing market headwinds and a challenging financial profile. This article analyses the recent changes in key valuation metrics such as the price-to-earnings (P/E) and price-to-book value (P/BV) ratios, compares them with peer averages and historical benchmarks, and assesses the implications for investors.
Read More
Tamilnadu Steel Tubes Ltd Downgraded to Strong Sell Amid Technical and Fundamental Concerns
Tamilnadu Steel Tubes Ltd, a micro-cap player in the Iron & Steel Products sector, has been downgraded from a Sell to a Strong Sell rating as of 20 Apr 2026. This revision reflects a deterioration in technical indicators, flat financial performance, and weak long-term fundamentals, despite the stock’s recent price appreciation. Investors should carefully consider the multiple factors driving this rating change before making investment decisions.
Read More
Tamilnadu Steel Tubes Ltd Upgraded to Sell on Technical Improvements Despite Flat Financials
Tamilnadu Steel Tubes Ltd (Stock ID: 648219) has seen its investment rating upgraded from Strong Sell to Sell as of 10 April 2026, driven primarily by changes in its technical outlook. Despite persistent fundamental challenges, the stock’s technical indicators have improved, prompting a reassessment of its near-term prospects. This article analyses the four key parameters—Quality, Valuation, Financial Trend, and Technicals—that influenced this rating revision, providing investors with a comprehensive understanding of the company’s current standing.
Read More Announcements
Announcement under Regulation 30 (LODR)-Newspaper Publication
25-May-2026 | Source : BSEWe have published the Finanicial Results for the QE & FYE 31.03.2026 in the News Paper Viz Makkal Kural (Tamil)and Trinity Mirror(English) and Copies of the news paper clippings are attached for your perusal. Kindly take the same on Records.
Board Meeting Outcome for OUTCOME OF BOARD MEETING HELD ON 23.05.2026
23-May-2026 | Source : BSEOUTCOME OF 1ST BOARD OF DIRECTORS HELD ON 23.05.2026
Submission Of Pdf Format Of Audited Fin Results For QE & FYE 31.03.2026 As Directed By BSE.
23-May-2026 | Source : BSEAs directed by BSE the pdf format is being submitted with regard to the 1st Board of Directors meeting 2026-27 held on 23.05.2026 and took on records the audited Fin Results for the QE & FYE 31.03.2026 along with limited review report issued by the auditors. kindly take the same on record.
Corporate Actions

No Upcoming Board Meetings

No Dividend history available

No Splits history available

No Bonus history available

No Rights history available
Quality key factors
Valuation key factors
Technicals key factors
 Technical Indicator Scale: Bearish, Mildly Bearish, Sideways, Mildly Bullish, Bullish Turned
 Shareholding Snapshot : Mar 2026
Shareholding Compare (%holding)
Non Institution
None
Held by 0 Schemes
Held by 0 FIIs
Seema Goyal (4.91%)
Kareetam Traders Ltd (19.61%)
63.25%
Quarterly Results Snapshot (Standalone) - Mar'26 - QoQ

QoQ Growth in quarter ended Mar 2026 is 35.39% vs -14.36% in Dec 2025
QoQ Growth in quarter ended Mar 2026 is 0.00% vs -100.00% in Dec 2025
Half Yearly Results Snapshot (Standalone) - Sep'25
Growth in half year ended Sep 2025 is 26.26% vs -1.81% in Sep 2024

Growth in half year ended Sep 2025 is -23.08% vs 85.71% in Sep 2024
Nine Monthly Results Snapshot (Standalone) - Dec'25
YoY Growth in nine months ended Dec 2025 is 23.68% vs 1.77% in Dec 2024
YoY Growth in nine months ended Dec 2025 is -33.33% vs 114.29% in Dec 2024
Annual Results Snapshot (Standalone) - Mar'26
YoY Growth in year ended Mar 2026 is 24.37% vs 3.30% in Mar 2025
YoY Growth in year ended Mar 2026 is -40.00% vs -64.29% in Mar 2025
About Tamilnadu Steel Tubes Ltd


