Dashboard
Company has a low Debt to Equity ratio (avg) at 0.07 times
Healthy long term growth as Net Sales has grown by an annual rate of 33.00% and Operating profit at 43.61%
With a growth in Net Profit of 66.87%, the company declared Very Positive results in Mar 26
Stock is technically in a Bullish range
High Institutional Holdings at 23.21%
Company is among the highest 1% of companies rated by MarketsMojo across all 4,000 stocks
Stock DNA
Industrial Manufacturing
INR 25,608 Cr (Small Cap)
78.00
54
0.12%
-0.15
8.18%
8.72
Total Returns (Price + Dividend) 
Latest dividend: 1.5 per share ex-dividend date: Sep-19-2025
Risk Adjusted Returns v/s
Returns Beta

News
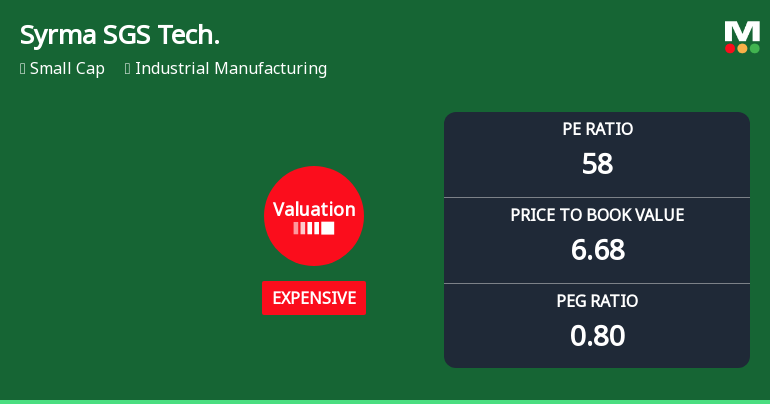
Syrma SGS Technology Ltd Valuation Shift Signals Price Attractiveness Change
Syrma SGS Technology Ltd has witnessed a notable shift in its valuation parameters, moving from a very expensive to an expensive rating, reflecting evolving market perceptions and price attractiveness within the industrial manufacturing sector. Despite a recent 4.34% decline in its share price, the company’s strong fundamentals and superior returns relative to the Sensex continue to attract investor interest.
Read MoreAre Syrma SGS Technology Ltd latest results good or bad?
Syrma SGS Technology Ltd's latest financial results for Q4 FY26 present a complex picture of growth and challenges. The company reported consolidated net sales of ₹1,465.01 crores, reflecting a robust year-on-year growth of 58.49% and a sequential increase of 15.89%. This performance indicates strong operational momentum and successful client acquisition, positioning Syrma within the high-growth segment of India's electronics manufacturing sector. However, the consolidated net profit for the quarter was ₹101.19 crores, which represents a decline of 1.56% compared to the previous quarter, despite a significant year-on-year increase of 54.63%. This disconnect between revenue growth and profit performance highlights underlying operational challenges, particularly in maintaining profitability amidst rising costs and competitive pricing pressures. The operating margin, excluding other income, contracted to 11.8...
Read More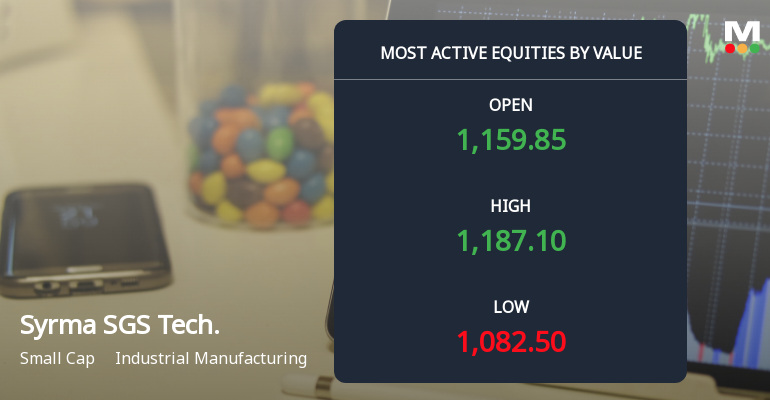
Syrma SGS Technology Ltd Sees Robust Trading Activity Amidst Market Rally
Syrma SGS Technology Ltd, a prominent player in the industrial manufacturing sector, has witnessed a remarkable surge in trading activity, driven by substantial value turnover and growing institutional interest. The stock has demonstrated robust momentum, hitting new 52-week and all-time highs while outperforming its sector and broader market indices.
Read More Announcements
Announcement under Regulation 30 (LODR)-Investor Presentation
07-Jun-2026 | Source : BSEIntimation under Regulation 30 of SEBI (Listing Obligations and Disclosure Requirements) Regulations 2025 - Investor Presentation
Announcement under Regulation 30 (LODR)-Analyst / Investor Meet - Intimation
25-May-2026 | Source : BSEIntimation under Regulation 30 of Securities and Exchange Board of India (Listing Obligations and Disclosure Requirements) Regulations 2015 (the Listing Regulations) for participating in Investor Meetings
Corporate Actions

No Upcoming Board Meetings

Syrma SGS Technology Ltd has declared 15% dividend, ex-date: 19 Sep 25

No Splits history available

No Bonus history available

No Rights history available
Quality key factors
Valuation key factors
Technicals key factors
 Technical Indicator Scale: Bearish, Mildly Bearish, Sideways, Mildly Bullish, Bullish Turned
 Shareholding Snapshot : Mar 2026
Shareholding Compare (%holding)
Promoters
None
Held by 27 Schemes (9.74%)
Held by 109 FIIs (6.61%)
Tancom Electronics Private Limited (32.84%)
Krishna Kumar Pant (6.35%)
30.93%
Quarterly Results Snapshot (Consolidated) - Mar'26 - QoQ

QoQ Growth in quarter ended Mar 2026 is 15.89% vs 10.32% in Dec 2025

QoQ Growth in quarter ended Mar 2026 is -1.56% vs 60.46% in Dec 2025
Half Yearly Results Snapshot (Consolidated) - Sep'25
Growth in half year ended Sep 2025 is 5.04% vs 51.76% in Sep 2024
Growth in half year ended Sep 2025 is 104.93% vs -2.36% in Sep 2024
Nine Monthly Results Snapshot (Consolidated) - Dec'25
YoY Growth in nine months ended Dec 2025 is 17.29% vs 41.72% in Dec 2024
YoY Growth in nine months ended Dec 2025 is 107.62% vs 44.11% in Dec 2024
Annual Results Snapshot (Consolidated) - Mar'26
YoY Growth in year ended Mar 2026 is 27.26% vs 19.42% in Mar 2025
YoY Growth in year ended Mar 2026 is 87.07% vs 58.27% in Mar 2025
About Syrma SGS Technology Ltd

Company Coordinates