Dashboard
Weak Long Term Fundamental Strength with a -4.54% CAGR growth in Net Sales over the last 5 years
- Low ability to service debt as the company has a high Debt to EBITDA ratio of 7.54 times
- The company has been able to generate a Return on Equity (avg) of 2.01% signifying low profitability per unit of shareholders funds
Negative results in Dec 25
Stock is technically in a Bearish range
32.66% of Promoter Shares are Pledged
Consistent Underperformance against the benchmark over the last 3 years
Stock DNA
Garments & Apparels
INR 6 Cr (Micro Cap)
40.00
24
0.00%
1.48
-1.12%
0.20
Total Returns (Price + Dividend) 
Supertex Inds. for the last several years.
Risk Adjusted Returns v/s
Returns Beta

News
When is the next results date for Supertex Industries Ltd?
The next results date for Supertex Industries Ltd is scheduled for 30 May 2026....
Read More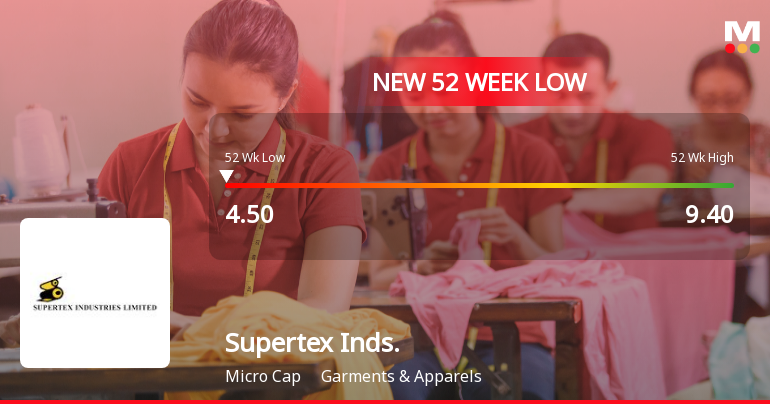
Supertex Industries Ltd Falls to 52-Week Low of Rs 4.5 as Sell-Off Deepens
A sharp decline of 19.64% today dragged Supertex Industries Ltd to a fresh 52-week low of Rs 4.5, marking a significant setback amid a broader market downturn. This latest fall extends the stock’s underperformance, which has seen it lose nearly 43% over the past year, far outpacing the Sensex’s modest 4% decline.
Read More Announcements
Announcement under Regulation 30 (LODR)-Newspaper Publication
01-Jun-2026 | Source : BSESubmission of Newspaper advertisement of the Audited Financial Results for the quarter and year ended 31st March 2026 published on 01st June 2026.
Board Meeting Outcome for Outcome Of Board Meeting Held On Saturday 30Th May 2026
30-May-2026 | Source : BSESubmission of Outcome of Board Meeting Held on Saturday 30th May 2026
Results- Financial Results For 31-03-2026
30-May-2026 | Source : BSESubmission of Audited Financial Results for the quarter and year ended 31st March 2026
Corporate Actions

No Upcoming Board Meetings

No Dividend history available

Supertex Industries Ltd has announced 10:1 stock split, ex-date: 07 Sep 11

No Bonus history available

No Rights history available
Quality key factors
Valuation key factors
Technicals key factors
 Technical Indicator Scale: Bearish, Mildly Bearish, Sideways, Mildly Bullish, Bullish Turned
 Shareholding Snapshot : Mar 2026
Shareholding Compare (%holding)
Non Institution
32.6579
Held by 1 Schemes (0.0%)
Held by 1 FIIs (0.0%)
Ramesh Kumar Mishra (6.71%)
Sujit Krishna Puthran (3.22%)
75.1%
Quarterly Results Snapshot (Standalone) - Mar'26 - YoY

YoY Growth in quarter ended Mar 2026 is -22.39% vs -73.45% in Mar 2025
YoY Growth in quarter ended Mar 2026 is 104.00% vs -1,350.00% in Mar 2025
Half Yearly Results Snapshot (Standalone) - Sep'25

Growth in half year ended Sep 2025 is -30.89% vs 12.18% in Sep 2024
Growth in half year ended Sep 2025 is -51.92% vs 842.86% in Sep 2024
Nine Monthly Results Snapshot (Standalone) - Dec'25
YoY Growth in nine months ended Dec 2025 is -36.89% vs 25.08% in Dec 2024
YoY Growth in nine months ended Dec 2025 is -80.88% vs 1,260.00% in Dec 2024
Annual Results Snapshot (Standalone) - Mar'26
YoY Growth in year ended Mar 2026 is -34.77% vs -18.88% in Mar 2025
YoY Growth in year ended Mar 2026 is 300.00% vs -172.73% in Mar 2025
About Supertex Industries Ltd


