Dashboard
Weak Long Term Fundamental Strength with an average Return on Capital Employed (ROCE) of 4.70%
- Poor long term growth as Net Sales has grown by an annual rate of 8.99% and Operating profit at -17.64% over the last 5 years
Flat results in Dec 25
Stock is technically in a Mildly Bearish range
Underperformed the market in the last 1 year
Stock DNA
Garments & Apparels
INR 261 Cr (Micro Cap)
69.00
24
0.29%
0.11
0.31%
0.54
Total Returns (Price + Dividend) 
Latest dividend: 2.5 per share ex-dividend date: Jul-14-2025
Risk Adjusted Returns v/s
Returns Beta

News
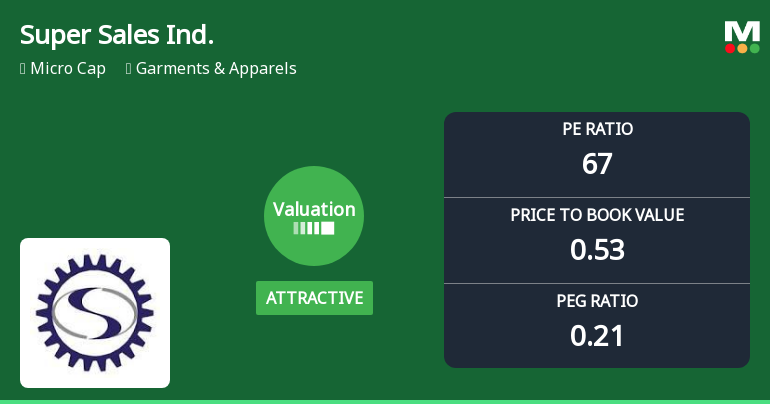
Super Sales India Ltd Valuation Shifts Signal Changing Market Sentiment
Super Sales India Ltd, a micro-cap player in the Garments & Apparels sector, has witnessed a notable shift in its valuation parameters, moving from a very attractive to an attractive rating. Despite a challenging earnings profile and elevated price multiples, recent market movements and comparative metrics suggest a nuanced change in price attractiveness that merits close investor attention.
Read MoreAre Super Sales India Ltd latest results good or bad?
Super Sales India Ltd's latest financial results for Q4 FY26 reflect significant operational challenges. The company reported net sales of ₹102.92 crores, which represents a quarter-on-quarter decline of 0.91% and a year-on-year contraction of 2.21%. This stagnation in revenue suggests weakening demand for its garments and apparel offerings. The net profit for the quarter was a loss of ₹1.39 crores, marking a substantial sequential deterioration of 59.77% from the previous quarter's loss of ₹0.87 crores. This trend of losses over four consecutive quarters raises concerns about the company's ability to achieve sustainable profitability. The operating profit margin, excluding other income, fell to 6.58%, down from 10.49% in the prior quarter, indicating severe margin compression likely driven by rising costs and pricing pressures. Additionally, the company's return on equity (ROE) stands at a mere 0.67%, w...
Read More
Super Sales India Ltd is Rated Sell
Super Sales India Ltd is rated 'Sell' by MarketsMOJO, with this rating last updated on 06 Apr 2026. However, the analysis and financial metrics discussed here reflect the stock's current position as of 10 May 2026, providing investors with an up-to-date view of the company's fundamentals, returns, and technical outlook.
Read More Announcements
Announcement under Regulation 30 (LODR)-Newspaper Publication
16-Jun-2026 | Source : BSENewspaper publication relating to lodgement of transfer of physical shares
Intimation Under Regulation 30 Of SEBI (Listing Obligations And Disclosure Requirements) Regulation 2015
05-Jun-2026 | Source : BSEIntimation under Regulation 30 of SEBI ( Listing Obligations and Disclosure Requirements) Regulation 2015
Announcement under Regulation 30 (LODR)-Newspaper Publication
02-Jun-2026 | Source : BSENewspaper Publication relating to transfer of shares to IEPF authority
Corporate Actions

No Upcoming Board Meetings

Super Sales India Ltd has declared 25% dividend, ex-date: 13 Jul 26

No Splits history available

No Bonus history available

No Rights history available
Quality key factors
Valuation key factors
Technicals key factors
 Technical Indicator Scale: Bearish, Mildly Bearish, Sideways, Mildly Bullish, Bullish Turned
 Shareholding Snapshot : Mar 2026
Shareholding Compare (%holding)
Promoters
None
Held by 0 Schemes
Held by 0 FIIs
Quattro Engineering India Private Limited (31.94%)
Prescient Wealth Management Private Limited (2.98%)
31.6%
Quarterly Results Snapshot (Standalone) - Mar'26 - QoQ

QoQ Growth in quarter ended Mar 2026 is -0.91% vs -1.01% in Dec 2025
QoQ Growth in quarter ended Mar 2026 is -59.77% vs -121.43% in Dec 2025
Half Yearly Results Snapshot (Standalone) - Sep'25
Growth in half year ended Sep 2025 is 2.62% vs -8.43% in Sep 2024
Growth in half year ended Sep 2025 is 142.50% vs -86.55% in Sep 2024
Nine Monthly Results Snapshot (Standalone) - Dec'25
YoY Growth in nine months ended Dec 2025 is 3.05% vs -6.43% in Dec 2024
YoY Growth in nine months ended Dec 2025 is 3,635.71% vs -100.64% in Dec 2024
Annual Results Snapshot (Standalone) - Mar'26
YoY Growth in year ended Mar 2026 is 1.68% vs -3.68% in Mar 2025
YoY Growth in year ended Mar 2026 is 302.84% vs -108.86% in Mar 2025
About Super Sales India Ltd


