Stock DNA
Other Electrical Equipment
INR 297 Cr ()
13.00
60
0.00%
0.00
0.00%
2.16
Total Returns (Price + Dividend) 
Sugs Lloyd for the last several years.
Risk Adjusted Returns v/s
Returns Beta

News
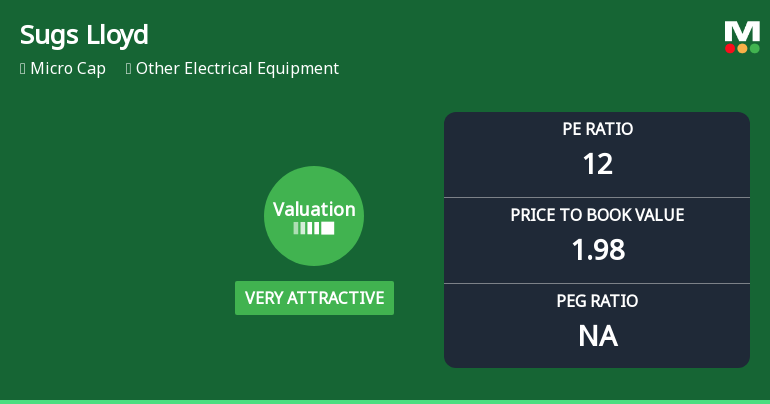
Sugs Lloyd Ltd Valuation Shifts to Very Attractive Amid Market Volatility
Sugs Lloyd Ltd, a micro-cap player in the Other Electrical Equipment sector, has seen a marked improvement in its valuation parameters, shifting from an attractive to a very attractive rating. This change comes amid a backdrop of sector volatility and peer valuation disparities, with the company’s price-to-earnings (P/E) and price-to-book value (P/BV) ratios signalling enhanced price attractiveness relative to historical averages and competitors.
Read More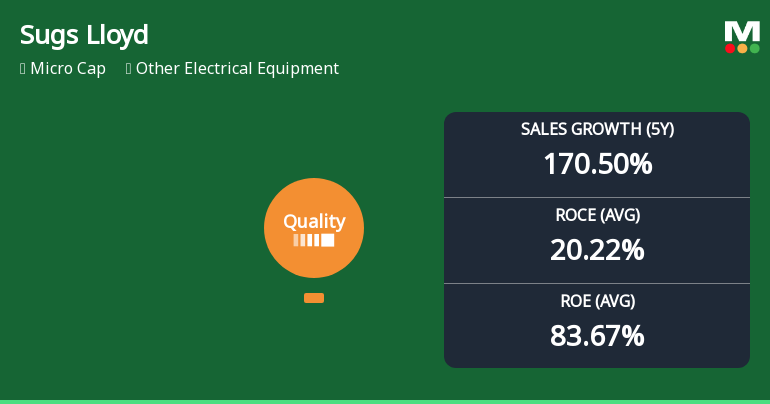
Sugs Lloyd Ltd Quality Grade Upgrade Highlights Strong Business Fundamentals
Sugs Lloyd Ltd, a micro-cap player in the Other Electrical Equipment sector, has seen its quality rating upgraded from 'Does Not Qualify' to 'Good' as of 12 May 2026. This shift reflects significant improvements in key financial metrics including return on equity (ROE), return on capital employed (ROCE), and debt management, signalling a more robust and consistent business performance amid a challenging market backdrop.
Read More Announcements
Announcement under Regulation 30 (LODR)-Award_of_Order_Receipt_of_Order
14-Jun-2026 | Source : BSEIntimation of receipt of order from North Bihar Power Distribution Company Limited(NBPDCL) under PM Surya Ghar-Muft Bijli Yojana (PMSG-MBY) aggregating Rs. 56.57 crores.
Compliances-Reg.24(A)-Annual Secretarial Compliance
29-May-2026 | Source : BSEAnnual Secretarial Compliance Report
Announcement under Regulation 30 (LODR)-Earnings Call Transcript
22-May-2026 | Source : BSETranscript of Earnings Call pertaining to the Audited Financial Results (Standalone & Consolidated) of the company for the Half year and year ended 31st March 2026.
Corporate Actions

No Upcoming Board Meetings

No Dividend history available

No Splits history available

No Bonus history available

No Rights history available
Quality key factors
Valuation key factors
Technicals key factors
 Technical Indicator Scale: Bearish, Mildly Bearish, Sideways, Mildly Bullish, Bullish Turned
 Shareholding Snapshot : Mar 2026
Shareholding Compare (%holding)
Promoters
None
Held by 0 Schemes
Held by 1 FIIs (1.02%)
Priti Shah (70.0%)
Rajesh Kumar Singla (1.72%)
22.17%
Quarterly Results Snapshot (Standalone) - Dec'25 - QoQ

QoQ Growth in quarter ended Dec 2025 is -1.65% vs 7.09% in Sep 2025
QoQ Growth in quarter ended Dec 2025 is 1.16% vs 4.15% in Sep 2025
Annual Results Snapshot (Standalone) - Mar'26
Not Applicable: The company has declared_date for only one period
Not Applicable: The company has declared_date for only one period


