Dashboard
Weak Long Term Fundamental Strength with an average Return on Capital Employed (ROCE) of 165.34%
- Poor long term growth as Net Sales has grown by an annual rate of 0% and Operating profit at 0% over the last 5 years
- High Debt Company with a Debt to Equity ratio (avg) at 0.96 times
Negative results in Mar 26
Falling Participation by Institutional Investors
Stock DNA
Telecom - Services
INR 1,342 Cr ()
NA (Loss Making)
39
0.00%
0.00
0.00%
1.18
Total Returns (Price + Dividend) 
STL Networks for the last several years.
Risk Adjusted Returns v/s
Returns Beta

News
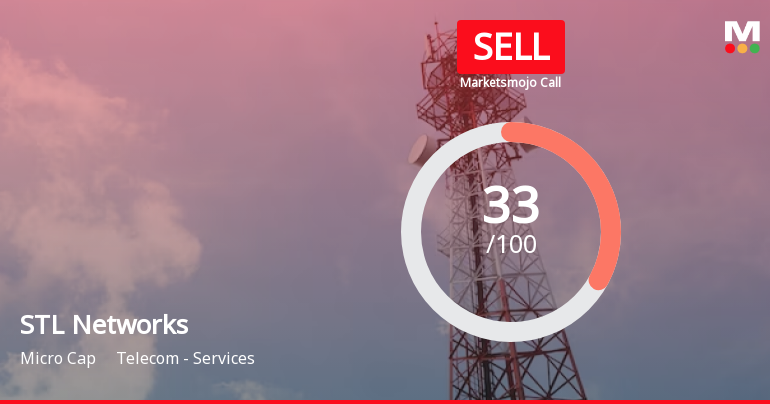
STL Networks Ltd is Rated Sell
STL Networks Ltd is rated 'Sell' by MarketsMOJO, with this rating last updated on 08 May 2026. However, the analysis and financial metrics presented here reflect the stock's current position as of 20 May 2026, providing investors with an up-to-date view of the company's fundamentals, returns, and technical outlook.
Read More
STL Networks Ltd Valuation Shifts to Fair Amid Mixed Market Performance
STL Networks Ltd has seen its valuation grade move from attractive to fair, reflecting a notable shift in price attractiveness amid challenging financial metrics and a volatile market backdrop. Despite a year-to-date return of 15.4%, outperforming the Sensex’s negative 11.6%, the company’s micro-cap status and deteriorating profitability ratios have weighed on investor sentiment, resulting in a 4.13% decline in share price on 19 May 2026.
Read More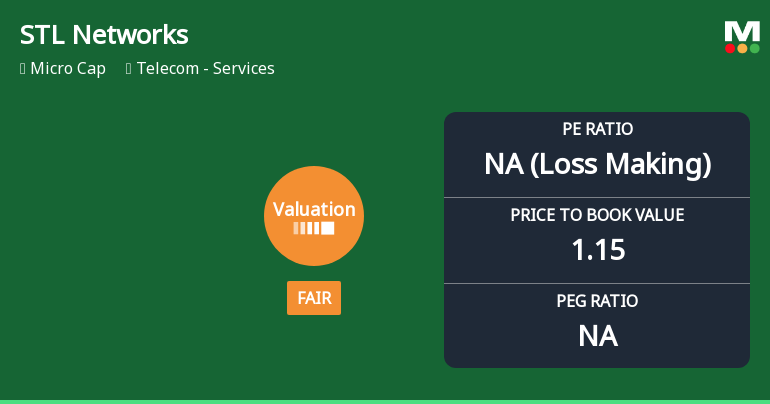
STL Networks Ltd Valuation Shifts to Fair Amid Mixed Market Performance
STL Networks Ltd, a micro-cap player in the Telecom - Services sector, has seen its valuation grade shift from attractive to fair, reflecting a nuanced change in price attractiveness amid challenging financial metrics and sector dynamics. Despite a recent dip in share price, the company’s valuation multiples now align more closely with industry peers, prompting a reassessment of its investment appeal.
Read More Announcements
Announcement under Regulation 30 (LODR)-Change in Management
11-Jun-2026 | Source : BSEAppointment of Mr. Chandrasekhara Rao Battula as Whole Time Director and Interim CEO with effect from June 11 2026
Announcement under Regulation 30 (LODR)-Resignation of Chief Executive Officer (CEO)
10-Jun-2026 | Source : BSEResignation of Chief Executive Officer
Announcement under Regulation 30 (LODR)-Resignation of Director
10-Jun-2026 | Source : BSEResignation of Director
Corporate Actions

No Upcoming Board Meetings

No Dividend history available

No Splits history available

No Bonus history available

No Rights history available
Quality key factors
Valuation key factors
Technicals key factors
 Technical Indicator Scale: Bearish, Mildly Bearish, Sideways, Mildly Bullish, Bullish Turned
 Shareholding Snapshot : Mar 2026
Shareholding Compare (%holding)
Non Institution
None
Held by 4 Schemes (3.94%)
Held by 44 FIIs (0.7%)
Twin Star Overseas Ltd (42.91%)
Uno Metals Ltd (2.51%)
34.71%
Quarterly Results Snapshot (Standalone) - Mar'26 - QoQ

QoQ Growth in quarter ended Mar 2026 is -40.74% vs 53.71% in Dec 2025
QoQ Growth in quarter ended Mar 2026 is -490.18% vs 81.70% in Dec 2025
Annual Results Snapshot (Standalone) - Mar'26
Not Applicable: The company has declared_date for only one period
Not Applicable: The company has declared_date for only one period


