Dashboard
Weak Long Term Fundamental Strength with an average Return on Equity (ROE) of 4.76%
- Poor long term growth as Net Sales has grown by an annual rate of 9.50% and Operating profit at 14.98% over the last 5 years
- Company's ability to service its debt is weak with a poor EBIT to Interest (avg) ratio of 0.81
Stock is technically in a Mildly Bearish range
Below par performance in long term as well as near term
Stock DNA
Garments & Apparels
INR 29 Cr (Micro Cap)
NA (Loss Making)
24
0.00%
0.56
-0.34%
1.12
Total Returns (Price + Dividend) 
STL Global for the last several years.
Risk Adjusted Returns v/s
Returns Beta

News
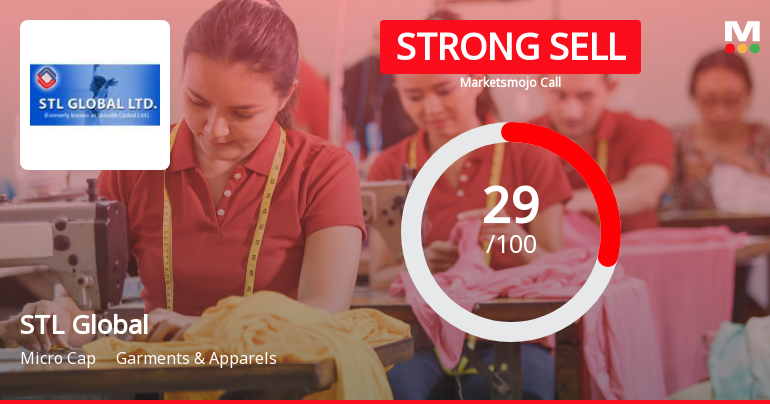
STL Global Ltd Downgraded to Strong Sell Amid Weak Technicals and Financial Trends
STL Global Ltd, a micro-cap player in the Garments & Apparels sector, has seen its investment rating downgraded from Sell to Strong Sell as of 18 May 2026. This shift reflects deteriorating technical indicators, a nuanced valuation outlook, and persistent financial challenges despite some recent operational improvements. The downgrade underscores growing investor caution amid the company’s underperformance relative to benchmarks and peers.
Read More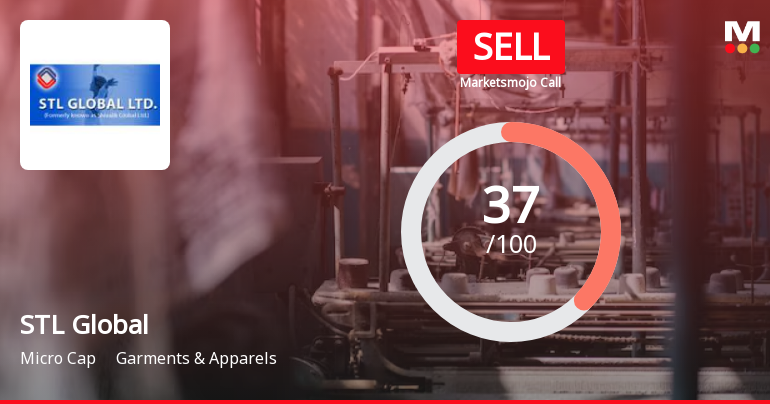
STL Global Ltd is Rated Sell
STL Global Ltd is rated 'Sell' by MarketsMOJO, with this rating last updated on 17 Mar 2026. While the rating was revised on that date, the analysis and financial metrics discussed here reflect the stock's current position as of 13 May 2026, providing investors with an up-to-date perspective on the company’s fundamentals, valuation, financial trends, and technical outlook.
Read More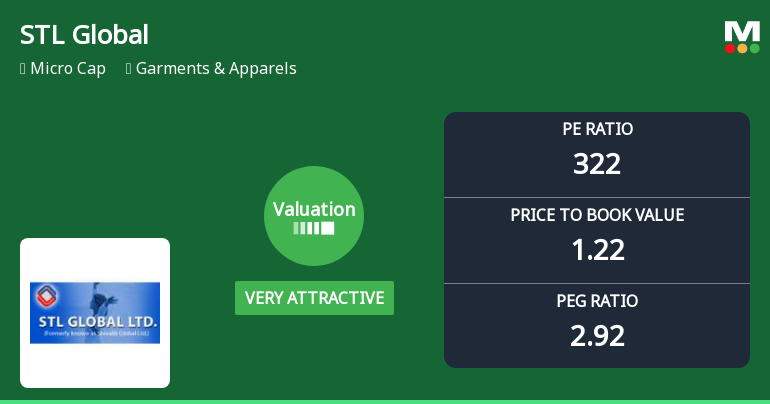
STL Global Ltd Valuation Shifts to Very Attractive Amidst Mixed Market Performance
STL Global Ltd, a micro-cap player in the Garments & Apparels sector, has witnessed a notable shift in its valuation parameters, moving from an attractive to a very attractive rating despite a challenging performance track record relative to the broader market. This article analyses the recent changes in key valuation metrics such as price-to-earnings (P/E) and price-to-book value (P/BV) ratios, compares them with industry peers, and assesses the implications for investors amid the company’s mixed returns over various time horizons.
Read More Announcements
Announcement under Regulation 30 (LODR)-Newspaper Publication
30-May-2026 | Source : BSENewspaper Publication
Outcome Of Board Meeting
29-May-2026 | Source : BSEOutcome of Board Meeting for Results
Compliances-Reg.24(A)-Annual Secretarial Compliance
26-May-2026 | Source : BSEAnnual Secretarial Compliance Report
Corporate Actions

No Upcoming Board Meetings

No Dividend history available

No Splits history available

No Bonus history available

No Rights history available
Quality key factors
Valuation key factors
Technicals key factors
 Technical Indicator Scale: Bearish, Mildly Bearish, Sideways, Mildly Bullish, Bullish Turned
 Shareholding Snapshot : Mar 2026
Shareholding Compare (%holding)
Promoters
None
Held by 0 Schemes
Held by 0 FIIs
Sangeeta Aggarwal (21.86%)
Heena R Shah (3.87%)
31.95%
Quarterly Results Snapshot (Standalone) - Mar'26 - YoY

YoY Growth in quarter ended Mar 2026 is -24.80% vs 17.18% in Mar 2025
YoY Growth in quarter ended Mar 2026 is -79.49% vs 48.68% in Mar 2025
Half Yearly Results Snapshot (Standalone) - Sep'25
Growth in half year ended Sep 2025 is 7.21% vs 26.36% in Sep 2024

Growth in half year ended Sep 2025 is 152.94% vs 79.76% in Sep 2024
Nine Monthly Results Snapshot (Standalone) - Dec'25
YoY Growth in nine months ended Dec 2025 is -2.27% vs 30.57% in Dec 2024
YoY Growth in nine months ended Dec 2025 is 322.73% vs 87.91% in Dec 2024
Annual Results Snapshot (Standalone) - Mar'26
YoY Growth in year ended Mar 2026 is -7.89% vs 26.97% in Mar 2025
YoY Growth in year ended Mar 2026 is 66.67% vs 74.42% in Mar 2025
About STL Global Ltd


