Dashboard
With a Negative Book Value, the company has a Weak Long Term Fundamental Strength
- Poor long term growth as Net Sales has grown by an annual rate of -5.82% and Operating profit at 0% over the last 5 years
- High Debt Company with a Debt to Equity ratio (avg) at 0 times
Flat results in Dec 25
Stock is technically in a Mildly Bearish range
Risky - Negative EBITDA
Reducing Promoter Confidence
Stock DNA
Industrial Manufacturing
INR 18 Cr (Micro Cap)
19.00
37
0.00%
2.46
-75.00%
13.16
Total Returns (Price + Dividend) 
Sterling Powerg. for the last several years.
Risk Adjusted Returns v/s
Returns Beta

News
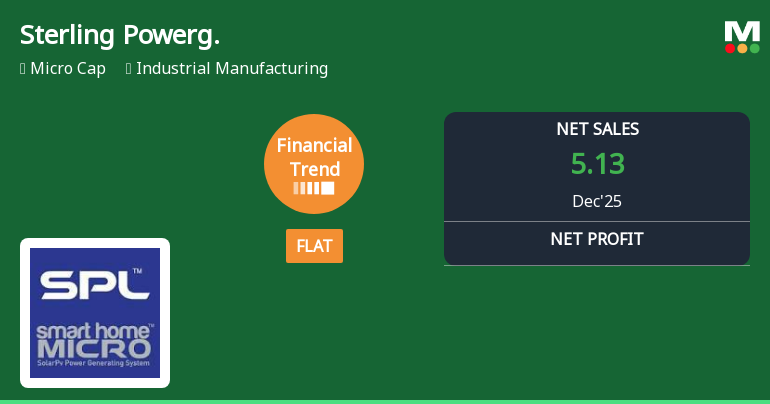
Sterling Powergensys Ltd Reports Flat Quarterly Performance Amid Margin Pressures
Sterling Powergensys Ltd, a micro-cap player in the industrial manufacturing sector, has reported a flat financial performance for the quarter ended December 2025, signalling a pause in its previously negative trend. Despite some operational improvements, the company continues to face significant headwinds, reflected in its subdued revenue growth and persistently weak returns on capital.
Read More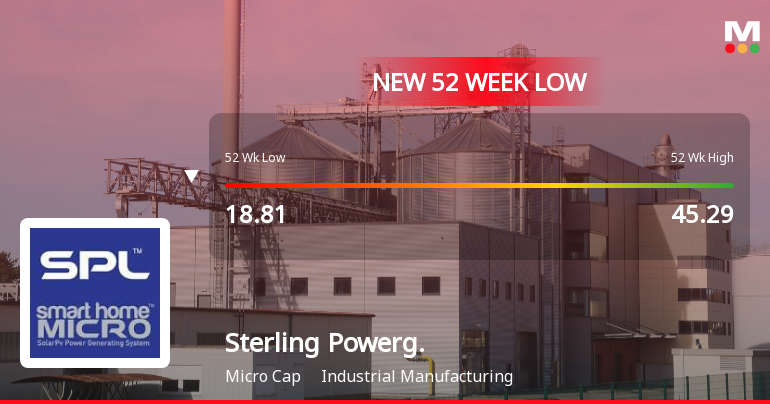
Sterling Powergensys Ltd Falls to 52-Week Low of Rs 16.9 as Sell-Off Deepens
A sharp decline over three consecutive sessions has dragged Sterling Powergensys Ltd to a fresh 52-week low of Rs 16.9 on 27 Mar 2026, marking a 15.46% loss in that period despite an intraday rally attempt today.
Read More
Sterling Powergensys Ltd Falls to 52-Week Low of Rs 17.35 as Sell-Off Deepens
A sharp decline in Sterling Powergensys Ltd has pushed the stock to a fresh 52-week low of Rs 17.35 on 24 Mar 2026, marking a significant 51.78% drop over the past year amid persistent selling pressure and deteriorating fundamentals.
Read More Announcements
Announcement under Regulation 30 (LODR)-Newspaper Publication
01-Jun-2026 | Source : BSEAs per attachment.
Board Meeting Outcome for Financial Results For Quarter And Year Ended March 31 2026.
29-May-2026 | Source : BSEAs per attachment
Appointment Of Internal Auditor Of The Company.
29-May-2026 | Source : BSEAs per Attachment
Corporate Actions

No Upcoming Board Meetings

No Dividend history available

No Splits history available

No Bonus history available

No Rights history available
Quality key factors
Valuation key factors
Technicals key factors
 Technical Indicator Scale: Bearish, Mildly Bearish, Sideways, Mildly Bullish, Bullish Turned
 Shareholding Snapshot : Mar 2026
Shareholding Compare (%holding)
Non Institution
None
Held by 0 Schemes
Held by 0 FIIs
S Venkata Subramanian (8.82%)
None
49.76%
Quarterly Results Snapshot (Standalone) - Mar'26 - QoQ

QoQ Growth in quarter ended Mar 2026 is 232.55% vs 518.07% in Dec 2025

QoQ Growth in quarter ended Mar 2026 is 1,257.14% vs 56.25% in Dec 2025
Half Yearly Results Snapshot (Standalone) - Sep'25
Growth in half year ended Sep 2025 is -85.29% vs 2,958.33% in Sep 2024
Growth in half year ended Sep 2025 is -1,400.00% vs 113.64% in Sep 2024
Nine Monthly Results Snapshot (Standalone) - Dec'25
YoY Growth in nine months ended Dec 2025 is -42.85% vs 2,412.77% in Dec 2024
YoY Growth in nine months ended Dec 2025 is -783.33% vs -103.82% in Dec 2024
Annual Results Snapshot (Standalone) - Mar'26
YoY Growth in year ended Mar 2026 is 88.89% vs 83.14% in Mar 2025
YoY Growth in year ended Mar 2026 is 421.05% vs -93.31% in Mar 2025
About Sterling Powergensys Ltd


