Dashboard
Poor Management Efficiency with a low ROE of 5.76%
- The company has been able to generate a Return on Equity (avg) of 5.76% signifying low profitability per unit of shareholders funds
Poor long term growth as Operating profit has grown by an annual rate 12.70% of over the last 5 years
Flat results in Dec 25
Stock is technically in a Mildly Bearish range
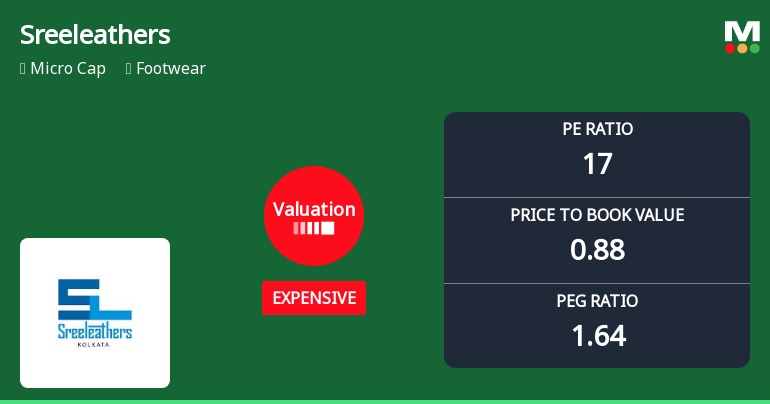
With ROE of 5, it has a Expensive valuation with a 0.9 Price to Book Value
Below par performance in long term as well as near term
Total Returns (Price + Dividend) 
Latest dividend: 0.9988009592326139 per share ex-dividend date: Feb-13-2026
Risk Adjusted Returns v/s
Returns Beta

News
Sreeleathers Ltd. Valuation Shifts Signal Price Attractiveness Challenges
Sreeleathers Ltd., a micro-cap player in the footwear sector, has witnessed a notable shift in its valuation parameters, moving from fair to expensive territory. Despite a modest day change of -0.11%, the company’s price-to-earnings (P/E) ratio now stands at 17.43, signalling a less attractive price point relative to its historical and peer averages. This article analyses the evolving valuation landscape of Sreeleathers, comparing key metrics with industry peers and assessing implications for investors.
Read More
Sreeleathers Ltd. Valuation Shifts Signal Price Attractiveness Concerns
Sreeleathers Ltd., a micro-cap player in the footwear sector, has seen its valuation parameters shift notably, moving from fair to expensive territory. Despite a modest day gain of 0.52%, the company’s price-to-earnings (P/E) ratio now stands at 17.46, raising questions about its price attractiveness relative to historical levels and peer benchmarks. This article analyses the recent valuation changes, compares them with industry peers, and assesses the implications for investors amid a challenging market backdrop.
Read More
Sreeleathers Ltd. is Rated Sell
Sreeleathers Ltd. is rated 'Sell' by MarketsMOJO, with this rating last updated on 18 Nov 2025. However, the analysis and financial metrics discussed here reflect the stock’s current position as of 23 April 2026, providing investors with an up-to-date view of the company’s fundamentals, valuation, financial trends, and technical outlook.
Read More Announcements
Announcement under Regulation 30 (LODR)-Newspaper Publication
01-Jun-2026 | Source : BSENews paper advertisement under Regulation 47 of SEBI (LODR) Regulations 2015 - Financial Results for the quarter and Year ended 31st March 2026
Compliances-Reg.24(A)-Annual Secretarial Compliance
30-May-2026 | Source : BSERegulation 24A SEBI (LODR) 2015 -Annual Secretarial Compliance Report for the Year ended 31st March 2026
Board Meeting Outcome for Approved The Audited Financial Statements For The Financial Year Ended March 31 2026 And The Audited Financial Results For The Quarter And Year Ended March 31 2026.
29-May-2026 | Source : BSEapproved the Audited Financial Statements for the financial year ended March 31 2026 and the Audited Financial Results for the quarter and year ended March 31 2026
Corporate Actions

No Upcoming Board Meetings

Sreeleathers Ltd. has declared 10% dividend, ex-date: 13 Feb 26

No Splits history available

No Bonus history available

No Rights history available
Quality key factors
Valuation key factors
Technicals key factors
 Technical Indicator Scale: Bearish, Mildly Bearish, Sideways, Mildly Bullish, Bullish Turned
 Shareholding Snapshot : Mar 2026
Shareholding Compare (%holding)
Promoters
None
Held by 0 Schemes
Held by 3 FIIs (6.9%)
Panchavati Tie- Up Pvt Ltd (19.99%)
Habrok India Master Lp (3.54%)
11.1%
Quarterly Results Snapshot (Standalone) - Mar'26 - YoY

YoY Growth in quarter ended Mar 2026 is 17.95% vs 7.16% in Mar 2025
YoY Growth in quarter ended Mar 2026 is 82.80% vs 10.67% in Mar 2025
Half Yearly Results Snapshot (Standalone) - Sep'25
Growth in half year ended Sep 2025 is 12.08% vs 1.32% in Sep 2024
Growth in half year ended Sep 2025 is 4.43% vs -27.35% in Sep 2024
Nine Monthly Results Snapshot (Standalone) - Dec'25
YoY Growth in nine months ended Dec 2025 is 11.35% vs -0.77% in Dec 2024
YoY Growth in nine months ended Dec 2025 is 10.36% vs -21.70% in Dec 2024
Annual Results Snapshot (Standalone) - Mar'26
YoY Growth in year ended Mar 2026 is 12.95% vs 1.03% in Mar 2025
YoY Growth in year ended Mar 2026 is 27.34% vs -15.94% in Mar 2025
About Sreeleathers Ltd.


