Dashboard
Weak Long Term Fundamental Strength with a 24.32% CAGR growth in Operating Profits over the last 5 years
- Low ability to service debt as the company has a high Debt to EBITDA ratio of 0.08 times
Stock is technically in a Bearish range
With ROE of 62.2, it has a Expensive valuation with a 13.2 Price to Book Value
Underperformed the market in the last 1 year
Stock DNA
Garments & Apparels
INR 30 Cr (Micro Cap)
7.00
24
0.00%
-0.23
4.61%
5.95
Total Returns (Price + Dividend) 
Sparkle GoldRock for the last several years.
Risk Adjusted Returns v/s
Returns Beta

News

Sparkle Gold Rock Ltd is Rated Sell
Sparkle Gold Rock Ltd is rated 'Sell' by MarketsMOJO, with this rating last updated on 31 Jan 2026. However, the analysis and financial metrics discussed here reflect the stock's current position as of 13 May 2026, providing investors with an up-to-date view of its fundamentals, returns, and market standing.
Read More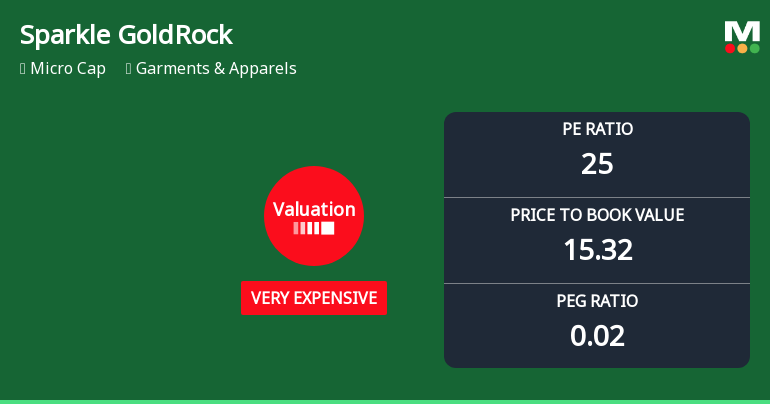
Sparkle Gold Rock Ltd Valuation Shifts Signal Heightened Price Risk
Sparkle Gold Rock Ltd, a micro-cap player in the Garments & Apparels sector, has seen its valuation parameters shift markedly, moving from expensive to very expensive territory. Despite robust return metrics, the stock’s elevated price-to-earnings and price-to-book ratios raise questions about its current price attractiveness relative to historical levels and peer benchmarks.
Read More
Sparkle Gold Rock Ltd is Rated Sell
Sparkle Gold Rock Ltd is rated 'Sell' by MarketsMOJO, with this rating last updated on 31 January 2026. However, the analysis and financial metrics discussed below reflect the stock's current position as of 23 April 2026, providing investors with an up-to-date view of the company's performance and outlook.
Read More Announcements
Complete Financials Results For Year Ended 31 March 2026.
13-Jun-2026 | Source : BSEComplete Financials Results for year ended 31 March 2026.
Announcement under Regulation 30 (LODR)-Newspaper Publication
30-May-2026 | Source : BSENewspaper advertisement published- Audited Financial results for quarter and year ended 31/03/2026.
Compliances-Reg.24(A)-Annual Secretarial Compliance
30-May-2026 | Source : BSEAnnual Compliance report for year 2025-26
Corporate Actions

No Upcoming Board Meetings

No Dividend history available

No Splits history available

No Bonus history available

No Rights history available
Quality key factors
Valuation key factors
Technicals key factors
 Technical Indicator Scale: Bearish, Mildly Bearish, Sideways, Mildly Bullish, Bullish Turned
 Shareholding Snapshot : Mar 2026
Shareholding Compare (%holding)
Non Institution
None
Held by 2 Schemes (0.87%)
Held by 0 FIIs
None
Sarita Devi Sharma (8.34%)
55.79%
Quarterly Results Snapshot (Standalone) - Mar'26 - YoY

YoY Growth in quarter ended Mar 2026 is 654.91% vs 0.00% in Mar 2025
YoY Growth in quarter ended Mar 2026 is 2,200.00% vs -250.00% in Mar 2025
Half Yearly Results Snapshot (Standalone) - Sep'25
Growth in half year ended Sep 2025 is 0.00% vs 0.00% in Sep 2024
Growth in half year ended Sep 2025 is 766.67% vs 71.43% in Sep 2024
Nine Monthly Results Snapshot (Standalone) - Dec'25
YoY Growth in nine months ended Dec 2025 is 2,568.86% vs 0.00% in Dec 2024
YoY Growth in nine months ended Dec 2025 is 1,200.00% vs -103.40% in Dec 2024
Annual Results Snapshot (Standalone) - Mar'26
YoY Growth in year ended Mar 2026 is 1,139.67% vs 0.00% in Mar 2025
YoY Growth in year ended Mar 2026 is 1,760.00% vs -107.79% in Mar 2025
About Sparkle Gold Rock Ltd


