Dashboard
Weak Long Term Fundamental Strength with an average Return on Capital Employed (ROCE) of 6.58%
- Poor long term growth as Net Sales has grown by an annual rate of 8.34% over the last 5 years
- Low ability to service debt as the company has a high Debt to EBITDA ratio of 5.87 times
Stock is technically in a Mildly Bearish range
Consistent Underperformance against the benchmark over the last 3 years
Total Returns (Price + Dividend) 
Latest dividend: 0.6 per share ex-dividend date: Sep-19-2014
Risk Adjusted Returns v/s
Returns Beta

News
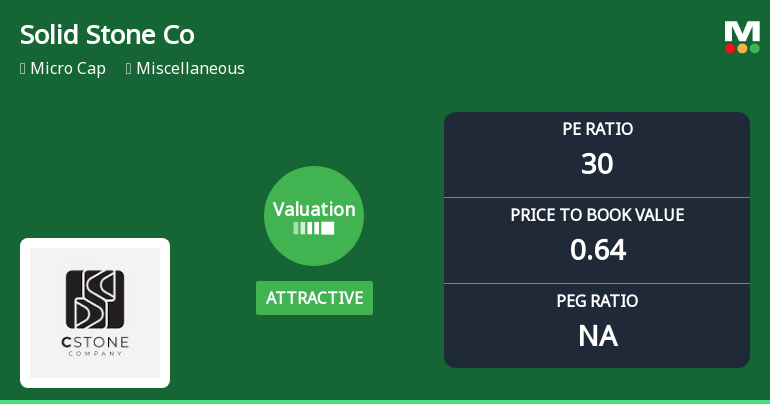
Solid Stone Company Ltd Valuation Shifts to Attractive Amid Mixed Market Returns
Solid Stone Company Ltd has witnessed a notable shift in its valuation parameters, moving from a very attractive to an attractive rating, despite a challenging market backdrop and mixed returns relative to the broader Sensex index. This article analyses the recent changes in key valuation metrics, compares them with peer averages, and assesses the implications for investors navigating this micro-cap stock in the miscellaneous sector.
Read MoreAre Solid Stone Company Ltd latest results good or bad?
Solid Stone Company Ltd's latest financial results for Q4 FY26 indicate a significant quarter-on-quarter increase in net sales, reaching ₹9.06 crores, which represents a 92.77% growth compared to the previous quarter. This surge follows a decline in the preceding quarter, highlighting the company's volatile revenue patterns. Year-on-year, net sales also show an 18.59% improvement, suggesting some recovery in demand. The net profit for the quarter was ₹0.30 crores, marking a substantial 650.00% increase from the prior quarter, which had seen a significant drop in profitability. However, despite this positive shift in net profit, the overall profitability metrics remain weak, with return on equity (ROE) averaging just 2.41% and return on capital employed (ROCE) at 6.30%. These figures reflect ongoing challenges in generating adequate returns for shareholders, underscoring the capital-intensive nature of the ...
Read More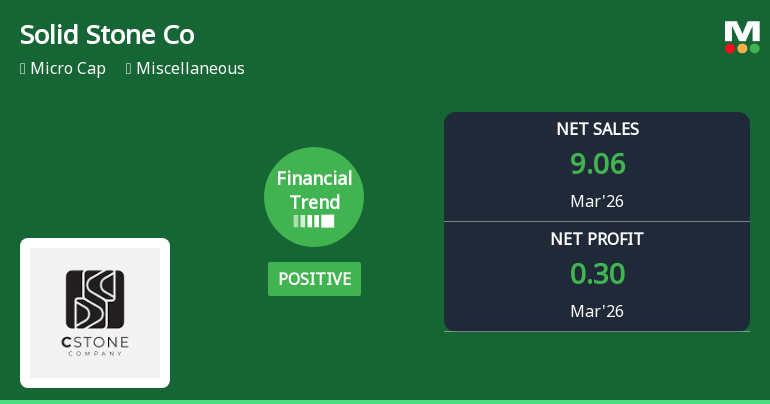
Solid Stone Company Ltd Reports Strong Quarterly Financial Turnaround Amid Mixed Long-Term Returns
Solid Stone Company Ltd has demonstrated a notable financial turnaround in the quarter ended March 2026, shifting from a flat to a positive growth trajectory. The company posted its highest quarterly net sales and profitability metrics in recent history, signalling a potential inflection point for this micro-cap player in the miscellaneous sector.
Read More Announcements
Compliances-Reg.24(A)-Annual Secretarial Compliance
21-May-2026 | Source : BSESubmission of Annual Secretarial Compliance Report under Regulation 24A of SEBI (LODR) 2015
Submission Of Audited Standalone And Consolidated Financial Results For Quarter And Year Ended 31St March 2026
12-May-2026 | Source : BSEPursuant to Regulation 30 and 33 of SEBI (LODR) 2015 we hereby submit Audited Standalone and Consolidated Financial Results approved by the Board of Directors of the Company at its Meeting held today.
Board Meeting Intimation for Approval And Take On Record The Audited Standalone And Consolidated Financial Results Of The Company For The Year Ended 31St March 2026
04-May-2026 | Source : BSESolid Stone Company Ltdhas informed BSE that the meeting of the Board of Directors of the Company is scheduled on 12/05/2026 inter alia to consider and approve and take on record the Audited Standalone and Consolidated financial results of the company for the Year ended 31st March 2026
Corporate Actions

No Upcoming Board Meetings

Solid Stone Company Ltd has declared 6% dividend, ex-date: 19 Sep 14

No Splits history available

No Bonus history available

No Rights history available
Quality key factors
Valuation key factors
Technicals key factors
 Technical Indicator Scale: Bearish, Mildly Bearish, Sideways, Mildly Bullish, Bullish Turned
 Shareholding Snapshot : Mar 2026
Shareholding Compare (%holding)
Promoters
None
Held by 0 Schemes
Held by 0 FIIs
Prakash B Khakhar (31.97%)
Falguni S Nayar (3.42%)
20.28%
Quarterly Results Snapshot (Consolidated) - Mar'26 - QoQ

QoQ Growth in quarter ended Mar 2026 is 92.77% vs -25.40% in Dec 2025
QoQ Growth in quarter ended Mar 2026 is 650.00% vs -66.67% in Dec 2025
Half Yearly Results Snapshot (Consolidated) - Sep'25
Growth in half year ended Sep 2025 is 4.08% vs -2.62% in Sep 2024

Growth in half year ended Sep 2025 is -52.94% vs -5.56% in Sep 2024
Nine Monthly Results Snapshot (Consolidated) - Dec'25
YoY Growth in nine months ended Dec 2025 is -16.72% vs 19.73% in Dec 2024
YoY Growth in nine months ended Dec 2025 is -67.74% vs 10.71% in Dec 2024
Annual Results Snapshot (Consolidated) - Mar'26
YoY Growth in year ended Mar 2026 is -7.01% vs 15.24% in Mar 2025
YoY Growth in year ended Mar 2026 is -39.76% vs -2.35% in Mar 2025
About Solid Stone Company Ltd


