Dashboard
Poor Management Efficiency with a low ROCE of 2.40%
- The company has been able to generate a Return on Capital Employed (avg) of 2.40% signifying low profitability per unit of total capital (equity and debt)
Company's ability to service its debt is weak with a poor EBIT to Interest (avg) ratio of 0.78
With ROCE of 12, it has a Very Expensive valuation with a 5.9 Enterprise value to Capital Employed
Despite the size of the company, domestic mutual funds hold only 0% of the company
Stock DNA
Trading & Distributors
INR 700 Cr (Micro Cap)
32.00
23
0.00%
0.84
15.19%
6.11
Total Returns (Price + Dividend) 
SMT Engineering for the last several years.
Risk Adjusted Returns v/s
Returns Beta

News

SMT Engineering Ltd Technical Momentum Shifts Amid Mixed Market Signals
SMT Engineering Ltd, a micro-cap player in the Trading & Distributors sector, has experienced a notable shift in its technical momentum, moving from a sideways trend to a mildly bearish stance. Despite a stable closing price of ₹367.85, a detailed analysis of key technical indicators reveals a complex picture of mixed signals, suggesting cautious investor sentiment amid volatile market conditions.
Read More
SMT Engineering Ltd is Rated Hold
SMT Engineering Ltd is rated 'Hold' by MarketsMOJO, with this rating last updated on 13 February 2026. However, the analysis and financial metrics discussed here reflect the stock's current position as of 25 April 2026, providing investors with an up-to-date view of the company’s performance and outlook.
Read More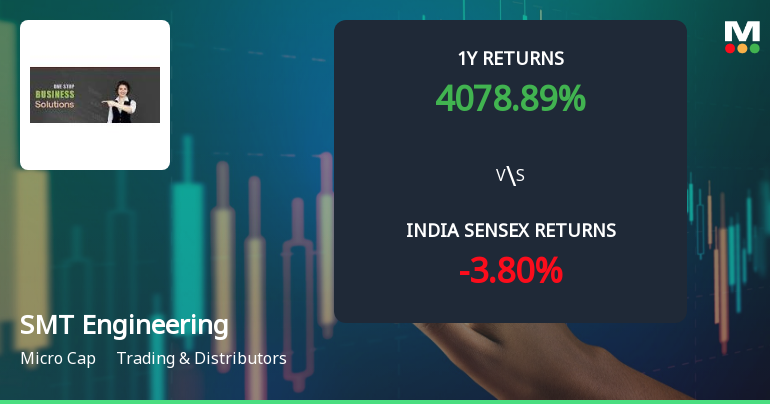
SMT Engineering Ltd Sees Mixed Technical Signals Amid Price Momentum Shift
SMT Engineering Ltd, a micro-cap player in the Trading & Distributors sector, has exhibited a notable shift in price momentum and technical indicators, reflecting a nuanced market sentiment. Despite a recent downgrade in its Mojo Grade from Buy to Hold, the stock’s price performance continues to outpace the broader market, signalling underlying strength amid mixed technical signals.
Read More Announcements
Announcement under Regulation 30 (LODR)-Memorandum of Understanding /Agreements
12-Jun-2026 | Source : BSESubmission on extending of Corporate Guarantee on enhancement of Cash Credit limit availed by Wholly Owned Subsidiary SAI MACHINE TOOLS PRIVATE LIMITED
Announcement under Regulation 30 (LODR)-Newspaper Publication
30-May-2026 | Source : BSESubmission of Newspaper Publication of Audited Standalone and Consolidated Financial Results for the Quarter and Year Ended March 31 2026
Approval Of Audited Standalone And Consolidated Financial Results For The Quarter And Financial Year Ended March 31 2026
29-May-2026 | Source : BSESubmission of Audited Standalone and Consolidated Financial Results for the Quarter and Financial year ended March 31 2026
Corporate Actions

No Upcoming Board Meetings

No Dividend history available

No Splits history available

No Bonus history available

No Rights history available
Quality key factors
Valuation key factors
Technicals key factors
 Technical Indicator Scale: Bearish, Mildly Bearish, Sideways, Mildly Bullish, Bullish Turned
 Shareholding Snapshot : Mar 2026
Shareholding Compare (%holding)
Promoters
None
Held by 0 Schemes
Held by 0 FIIs
Ajay Jaiswal (19.93%)
Jitendra Rasiklal Sanghavi (2.77%)
31.7%
Quarterly Results Snapshot (Consolidated) - Mar'26 - QoQ

QoQ Growth in quarter ended Mar 2026 is 175.67% vs -21.24% in Dec 2025
QoQ Growth in quarter ended Mar 2026 is 419.83% vs -63.46% in Dec 2025
Half Yearly Results Snapshot (Consolidated) - Sep'25
Growth in half year ended Sep 2025 is 10,647.37% vs 5,600.00% in Sep 2024
Growth in half year ended Sep 2025 is 3,380.00% vs -90.27% in Sep 2024
Nine Monthly Results Snapshot (Consolidated) - Dec'25

YoY Growth in nine months ended Dec 2025 is 9,276.60% vs 9,300.00% in Dec 2024
YoY Growth in nine months ended Dec 2025 is 3,700.00% vs -90.24% in Dec 2024
Annual Results Snapshot (Consolidated) - Mar'26
YoY Growth in year ended Mar 2026 is 671.84% vs 721.09% in Mar 2025
YoY Growth in year ended Mar 2026 is 834.41% vs 247.02% in Mar 2025
About SMT Engineering Ltd


