Dashboard
Strong ability to service debt as the company has a low Debt to EBITDA ratio of 0.38 times
Healthy long term growth as Operating profit has grown by an annual rate 65.26%
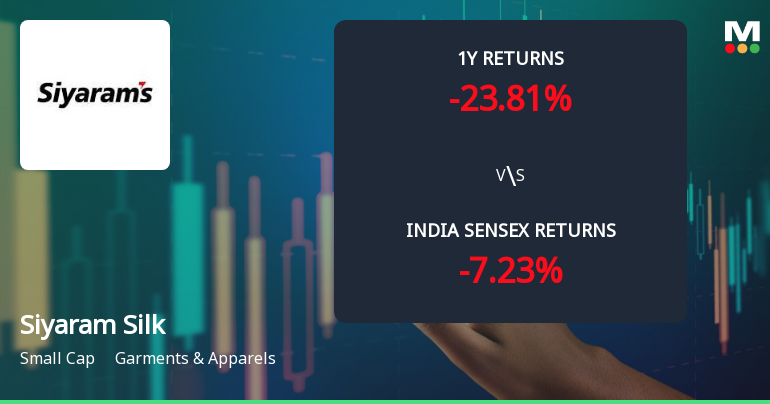
Stock is technically in a Mildly Bearish range
With ROCE of 15.9, it has a Attractive valuation with a 1.8 Enterprise value to Capital Employed
Despite the size of the company, domestic mutual funds hold only 0% of the company
Stock DNA
Garments & Apparels
INR 2,831 Cr (Small Cap)
12.00
42
2.60%
0.14
15.45%
1.91
Total Returns (Price + Dividend) 
Latest dividend: 4 per share ex-dividend date: May-25-2026
Risk Adjusted Returns v/s
Returns Beta

News
Siyaram Silk Mills Ltd Technical Momentum Shifts Amid Mixed Market Signals
Siyaram Silk Mills Ltd, a small-cap player in the Garments & Apparels sector, has recently experienced a notable shift in its technical momentum, moving from a sideways trend to a mildly bearish stance. Despite a downgrade in price performance with a 6.19% drop on 21 May 2026, the stock’s technical indicators present a complex picture, blending bullish and bearish signals across different timeframes.
Read More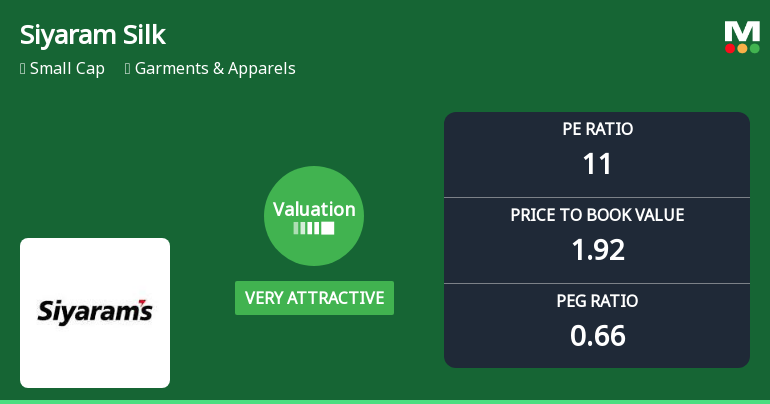
Siyaram Silk Mills Ltd Valuation Shifts Signal Renewed Price Attractiveness
Siyaram Silk Mills Ltd has witnessed a significant shift in its valuation parameters, moving from an attractive to a very attractive grade, despite a recent 6.19% decline in its share price. This re-rating comes amid a broader market context where the garment and apparel sector faces mixed investor sentiment, yet Siyaram’s improved price-to-earnings and price-to-book ratios suggest a compelling entry point for discerning investors.
Read More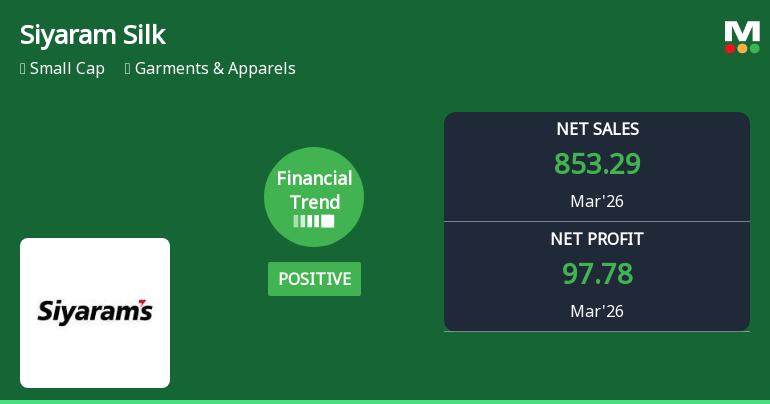
Siyaram Silk Mills Ltd Reports Strong Quarterly Turnaround with Record Revenue and Profit Margins
Siyaram Silk Mills Ltd has delivered a remarkable financial turnaround in the quarter ended March 2026, posting record-high revenues and profit margins that mark a significant improvement from its previous negative trend. The company’s financial trend score surged from -12 to +8 over the last three months, signalling a positive shift in operational performance and investor sentiment.
Read More Announcements
Disclosures under Reg. 10(6) of SEBI (SAST) Regulations 2011
12-Jun-2026 | Source : BSEThe Exchange has received the disclosure under Regulation 10(6) of SEBI (Substantial Acquisition of Shares & Takeovers) Regulations 2011 for Ramesh Kumar Poddar & Others
Disclosures under Reg. 29(2) of SEBI (SAST) Regulations 2011
11-Jun-2026 | Source : BSEThe Exchange has received the disclosure under Regulation 29(2) of SEBI (Substantial Acquisition of Shares & Takeovers) Regulations 2011 for Anurag P Poddar
Disclosures under Reg. 29(2) of SEBI (SAST) Regulations 2011
11-Jun-2026 | Source : BSEThe Exchange has received the disclosure under Regulation 29(2) of SEBI (Substantial Acquisition of Shares & Takeovers) Regulations 2011 for Ankit P Poddar
Corporate Actions

No Upcoming Board Meetings

Siyaram Silk Mills Ltd has declared 200% dividend, ex-date: 25 May 26

Siyaram Silk Mills Ltd has announced 2:10 stock split, ex-date: 25 Oct 17

Siyaram Silk Mills Ltd has announced 1:2 bonus issue, ex-date: 19 Oct 06

No Rights history available
Quality key factors
Valuation key factors
Technicals key factors
 Technical Indicator Scale: Bearish, Mildly Bearish, Sideways, Mildly Bullish, Bullish Turned
 Shareholding Snapshot : Mar 2026
Shareholding Compare (%holding)
Promoters
None
Held by 1 Schemes (0.0%)
Held by 63 FIIs (2.26%)
Pkp Enterprises Llp (23.81%)
Abakkus Emerging Opportunities Fund-1 (1.59%)
22.94%
Quarterly Results Snapshot (Consolidated) - Mar'26 - YoY

YoY Growth in quarter ended Mar 2026 is 15.91% vs 13.65% in Mar 2025
YoY Growth in quarter ended Mar 2026 is 35.71% vs 4.37% in Mar 2025
Half Yearly Results Snapshot (Consolidated) - Sep'25
Growth in half year ended Sep 2025 is 19.72% vs -2.79% in Sep 2024
Growth in half year ended Sep 2025 is 14.63% vs 11.78% in Sep 2024
Nine Monthly Results Snapshot (Consolidated) - Dec'25
YoY Growth in nine months ended Dec 2025 is 15.74% vs 2.85% in Dec 2024

YoY Growth in nine months ended Dec 2025 is 6.43% vs 8.08% in Dec 2024
Annual Results Snapshot (Consolidated) - Mar'26
YoY Growth in year ended Mar 2026 is 15.79% vs 6.19% in Mar 2025
YoY Growth in year ended Mar 2026 is 17.14% vs 6.70% in Mar 2025
About Siyaram Silk Mills Ltd


