Dashboard
Company has a low Debt to Equity ratio (avg) at 0.02 times
- ROCE(HY) Highest at 13.21%
- DEBTORS TURNOVER RATIO(HY) Highest at 20.50 times
- NET SALES(Q) Highest at Rs 5,240.36 cr
Stock is technically in a Mildly Bullish range
With ROE of 9.3, it has a Very Expensive valuation with a 2.3 Price to Book Value
Majority shareholders : Promoters
Consistent Returns over the last 3 years
Stock DNA
Iron & Steel Products
INR 27,510 Cr (Small Cap)
25.00
26
0.42%
0.02
8.81%
2.31
Total Returns (Price + Dividend) 
Latest dividend: 2.2 per share ex-dividend date: Aug-19-2025
Risk Adjusted Returns v/s
Returns Beta

News
Shyam Metalics & Energy Ltd is Rated Hold
Shyam Metalics & Energy Ltd is rated 'Hold' by MarketsMOJO, with this rating last updated on 11 May 2026. While the rating was revised on that date, the analysis and financial metrics discussed here reflect the company’s current position as of 21 May 2026, providing investors with an up-to-date view of the stock’s fundamentals, returns, and technical outlook.
Read MoreAre Shyam Metalics & Energy Ltd latest results good or bad?
Shyam Metalics & Energy Ltd's latest financial results for the quarter ended March 2026 indicate a significant operational turnaround. The company reported net sales of ₹5,240.36 crores, reflecting an 18.52% quarter-on-quarter increase and a 26.60% year-on-year growth. This marks the highest quarterly revenue performance in at least eight quarters, suggesting improved demand conditions and effective pricing strategies. The net profit for the same quarter reached ₹319.09 crores, which is a 61.78% increase from the previous quarter, indicating strong profitability driven by operational efficiencies. The operating margin also saw a notable expansion, reaching 13.87%, the highest in the last eight quarters, which is attributed to a better product mix and improved capacity utilization. Additionally, the return on equity (ROE) stood at 15.72%, demonstrating solid capital efficiency, although it is slightly belo...
Read More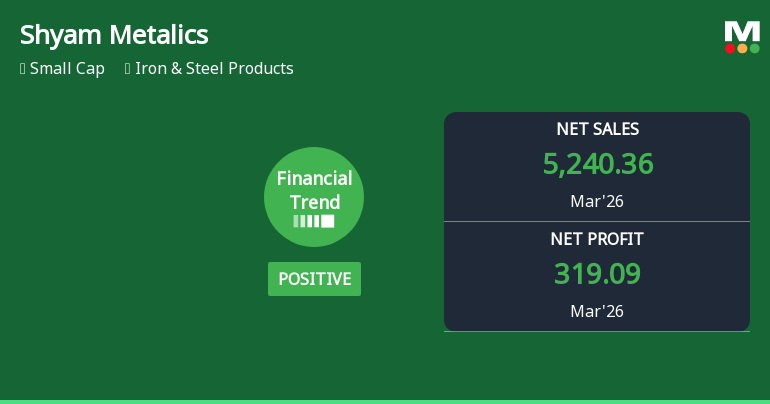
Shyam Metalics & Energy Ltd Reports Strong Quarterly Turnaround with Record Revenue and Profit Margins
Shyam Metalics & Energy Ltd has demonstrated a remarkable financial turnaround in the quarter ended March 2026, posting record-high net sales and profit margins that mark a significant improvement over recent quarters. This shift from a negative to a positive financial trend has been accompanied by an upgrade in its Mojo Grade from Sell to Hold, signalling renewed investor confidence amid a challenging iron and steel sector.
Read More Announcements
Announcement under Regulation 30 (LODR)-Allotment of ESOP / ESPS
16-Jun-2026 | Source : BSEIntimation of Exercise of Options by Eligible Employees
Announcement under Regulation 30 (LODR)-Analyst / Investor Meet - Intimation
12-Jun-2026 | Source : BSEInvestors / Analyst Meet has been scheduled on Wednesday 17th June 2026 at Mumbai
Announcement under Regulation 30 (LODR)-Analyst / Investor Meet - Outcome
11-Jun-2026 | Source : BSEOutcome of the Investor Meet held today on 11th June 2026
Corporate Actions

No Upcoming Board Meetings

Shyam Metalics & Energy Ltd has declared 22% dividend, ex-date: 19 Aug 25

No Splits history available

No Bonus history available

No Rights history available
Quality key factors
Valuation key factors
Technicals key factors
 Technical Indicator Scale: Bearish, Mildly Bearish, Sideways, Mildly Bullish, Bullish Turned
 Shareholding Snapshot : Mar 2026
Shareholding Compare (%holding)
Promoters
None
Held by 20 Schemes (1.63%)
Held by 81 FIIs (3.09%)
Subham Buildwell Pvt. Ltd. (21.86%)
Life Insurance Corporation Of India (5.47%)
4.76%
Quarterly Results Snapshot (Consolidated) - Mar'26 - QoQ

QoQ Growth in quarter ended Mar 2026 is 18.52% vs -1.03% in Dec 2025
QoQ Growth in quarter ended Mar 2026 is 61.78% vs -24.65% in Dec 2025
Half Yearly Results Snapshot (Consolidated) - Sep'25
Growth in half year ended Sep 2025 is 22.50% vs 15.49% in Sep 2024
Growth in half year ended Sep 2025 is 12.67% vs -28.56% in Sep 2024
Nine Monthly Results Snapshot (Consolidated) - Dec'25
YoY Growth in nine months ended Dec 2025 is 20.86% vs 14.73% in Dec 2024
YoY Growth in nine months ended Dec 2025 is 8.96% vs -15.47% in Dec 2024
Annual Results Snapshot (Consolidated) - Mar'26
YoY Growth in year ended Mar 2026 is 22.39% vs 14.88% in Mar 2025
YoY Growth in year ended Mar 2026 is 17.85% vs -12.24% in Mar 2025
About Shyam Metalics & Energy Ltd

Company Coordinates