Dashboard
Weak Long Term Fundamental Strength with a -58.96% CAGR growth in Operating Profits over the last 5 years
- Low ability to service debt as the company has a high Debt to EBITDA ratio of 19.39 times
- The company has been able to generate a Return on Equity (avg) of 6.24% signifying low profitability per unit of shareholders funds
Stock is technically in a Mildly Bearish range
Stock DNA
Media & Entertainment
INR 30 Cr (Micro Cap)
4.00
21
0.00%
1.12
5.60%
0.65
Total Returns (Price + Dividend) 
Sharpline Broadc for the last several years.
Risk Adjusted Returns v/s
Returns Beta

News

Sharpline Broadcast Ltd is Rated Sell
Sharpline Broadcast Ltd is rated 'Sell' by MarketsMOJO, with this rating last updated on 15 Apr 2026. However, the analysis and financial metrics discussed here reflect the stock's current position as of 30 April 2026, providing investors with the latest insights into the company’s performance and outlook.
Read More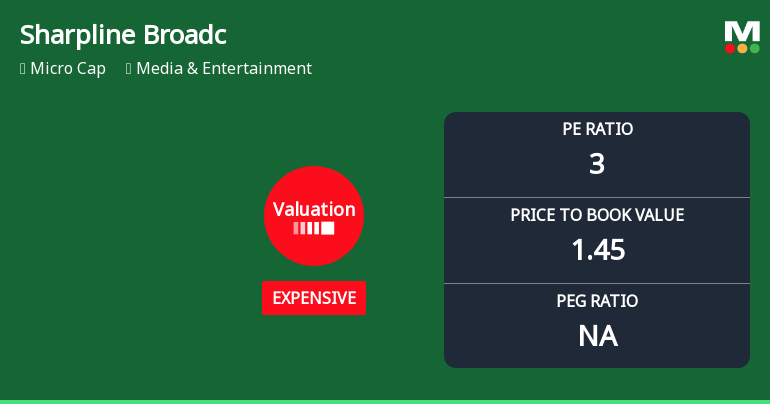
Sharpline Broadcast Ltd Valuation Shifts Signal Price Attractiveness Concerns
Sharpline Broadcast Ltd, a micro-cap player in the Media & Entertainment sector, has seen its valuation parameters shift notably, with its price-to-earnings (P/E) and price-to-book value (P/BV) ratios moving from fair to expensive territory. Despite a modest recent price dip, the stock’s valuation contrasts sharply with its historical performance and peer group metrics, prompting a downgrade in its investment grade to Sell by MarketsMOJO as of 15 April 2026.
Read More
Sharpline Broadcast Ltd Upgraded to Hold as Technicals Improve Amid Mixed Financials
Sharpline Broadcast Ltd has seen its investment rating upgraded from Sell to Hold, driven primarily by a marked improvement in technical indicators and robust quarterly financial performance. Despite lingering concerns over long-term fundamentals and valuation metrics, the recent positive momentum in price action and earnings growth has prompted a reassessment of the stock’s outlook.
Read More Announcements
Announcement under Regulation 30 (LODR)-Newspaper Publication
01-Jun-2026 | Source : BSEWith reference to the above captioned subject please find enclosed herewith the clippings of the English newspaper Financial Express and Hindi Newspaper Jansatta dated 01st Jun 2026 in which Audited Standalone and Consolidated Financial Results for the quarter and year ended 31st May 2026 has been published. This is for your kind information and record please.
Audited Financial Results As Per Regulation 33 Of The SEBI (Listing Obligations And Disclosure Requirements) Regulations 2015.
30-May-2026 | Source : BSEWith reference to the above captioned subject it is to inform you that following are the Audited Financial Results approved at the Board Meeting held today i.e. on Saturday 30th May 2026 at 12:00 PM and concluded at 08:00PM at the registered office of the Company to review and approve the following: 1. The Board considered and approved the Audited Standalone and Consolidated Financial Results of the Company for the quarter and year ended 31st March 2026. 2. The Board reviewed and took on record the Auditors Report on the Audited Financial Results of the Company for the quarter and year ended 31st March 2026.
Board Meeting Outcome for Submission Of Outcome Of The Board Meeting Held On 30.05.2026
30-May-2026 | Source : BSEWith reference to the above captioned subject it is to inform you that following are the outcome of the Board Meeting held on 30th May 2026 at 12:00 P.M. and concluded on 30th May 2026 at 08:00 P.M. at the registered office of the Company. 1. The Board considered and approved the Audited Standalone and Consolidated Financial Results of the Company for the quarter and year ended 31st March 2026. 2. The Board reviewed and took on record the Auditors Report on the Audited Financial Results of the Company for the quarter and year ended 31st March 2026.
Corporate Actions

No Upcoming Board Meetings

No Dividend history available

No Splits history available

No Bonus history available

No Rights history available
Quality key factors
Valuation key factors
Technicals key factors
 Technical Indicator Scale: Bearish, Mildly Bearish, Sideways, Mildly Bullish, Bullish Turned
 Shareholding Snapshot : Mar 2026
Shareholding Compare (%holding)
Non Institution
None
Held by 0 Schemes
Held by 1 FIIs (0.15%)
Spaceship Infra Pvt Ltd (14.3%)
Sadhna Business Network Pvt Ltd (15.73%)
33.09%
Quarterly Results Snapshot (Consolidated) - Mar'26 - QoQ

QoQ Growth in quarter ended Mar 2026 is 69.70% vs 5.38% in Dec 2025

QoQ Growth in quarter ended Mar 2026 is -39.22% vs 410.98% in Dec 2025
Half Yearly Results Snapshot (Standalone) - Sep'25
Growth in half year ended Sep 2025 is 41.38% vs -5.95% in Sep 2024
Growth in half year ended Sep 2025 is -6.80% vs -330.30% in Sep 2024
Nine Monthly Results Snapshot (Standalone) - Dec'25
YoY Growth in nine months ended Dec 2025 is 63.93% vs 10.43% in Dec 2024
YoY Growth in nine months ended Dec 2025 is 155.58% vs -268.06% in Dec 2024
Annual Results Snapshot (Consolidated) - Mar'26
YoY Growth in year ended Mar 2026 is 90.43% vs 82.92% in Mar 2025
YoY Growth in year ended Mar 2026 is 537.40% vs -20.13% in Mar 2025
About Sharpline Broadcast Ltd

Company Coordinates