Dashboard
With a Operating Losses, the company has a Weak Long Term Fundamental Strength
- Poor long term growth as Operating profit has grown by an annual rate -16.74% of over the last 5 years
- Company's ability to service its debt is weak with a poor EBIT to Interest (avg) ratio of -0.24
- PAT(Q) At Rs -0.98 cr has Fallen at -1080.0%
- NET SALES(9M) At Rs 8.25 cr has Grown at -36.64%
- PBDIT(Q) Lowest at Rs -0.99 cr.
Risky - Negative EBITDA
Stock DNA
Industrial Manufacturing
INR 73 Cr (Micro Cap)
NA (Loss Making)
24
0.00%
-0.10
3.23%
11.58
Total Returns (Price + Dividend) 
Latest dividend: 0.3300 per share ex-dividend date: Dec-08-2016
Risk Adjusted Returns v/s
Returns Beta

News
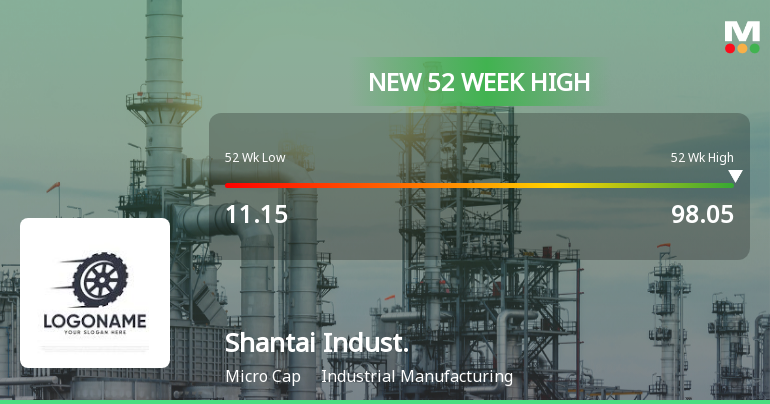
Broad-Based Technical Strength Lifts Shantai Industries Ltd to 52-Week High of Rs 98.05
Surging past its previous peaks, Shantai Industries Ltd touched a fresh 52-week high of Rs 98.05 on 13 May 2026, marking a remarkable ascent from its low of Rs 11.15 just a year ago. This rally, driven by a confluence of strong technical signals and sustained price momentum, has propelled the stock to outperform its sector and the broader market by a significant margin.
Read More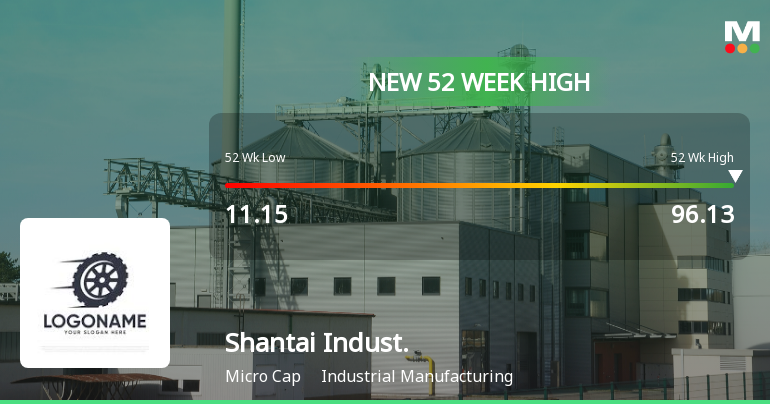
Broad-Based Technical Strength Lifts Shantai Industries Ltd to 52-Week High of Rs 96.13
Surging to a new 52-week high of Rs 96.13 on 12 May 2026, Shantai Industries Ltd has demonstrated remarkable price momentum, rallying over 50% in the past 21 trading sessions. This milestone caps a spectacular 539.16% gain over the last year, vastly outperforming the Sensex’s decline of 8.71% during the same period.
Read More
Broad-Based Technical Strength Lifts Shantai Industries Ltd to 52-Week High of Rs 94.25
From a low of Rs 11.15 to a new peak of Rs 94.25, Shantai Industries Ltd has surged over 500% in the past year, defying the broader market's downward trend. This remarkable rally is underpinned by a confluence of bullish technical indicators and sustained price momentum, marking a significant milestone for the micro-cap industrial manufacturing stock.
Read More Announcements
Updates on Open Offer
01-Jun-2026 | Source : BSESaffron Capital Advisors Pvt Ltd (Manager to the Open Offer) has submitted to BSE a copy of Reminder Advertisement dated May 29 2026 for the attention of the Public Shareholders of Shantai Industries Ltd (Target Company).
Announcement under Regulation 30 (LODR)-Newspaper Publication
27-May-2026 | Source : BSEPlease enclosed herewith newspaper publication of extract of standalone unaudited financial result for quarter and year ended on march 31 2026.
Updates on Open Offer
25-May-2026 | Source : BSESaffron Capital Advisors Pvt Ltd (Manager to the Open Offer) has submitted to BSE a copy of offer opening public announcement under Regulation 18(7) of the SEBI (SAST) Regulations 2011 as amended and corrigendum to the detailed public statement and the Draft Letter of Offer (Corrigendum) for the attention of the Public Shareholders of Shantai Industries Ltd (Target Company).
Corporate Actions

No Upcoming Board Meetings

Shantai Industries Ltd has declared 10% dividend, ex-date: 08 Dec 16

Shantai Industries Ltd has announced 2:10 stock split, ex-date: 09 May 25

Shantai Industries Ltd has announced 2:1 bonus issue, ex-date: 07 Jul 17

No Rights history available
Quality key factors
Valuation key factors
Technicals key factors
 Technical Indicator Scale: Bearish, Mildly Bearish, Sideways, Mildly Bullish, Bullish Turned
 Shareholding Snapshot : Mar 2026
Shareholding Compare (%holding)
Promoters
None
Held by 0 Schemes
Held by 0 FIIs
Vasudev Fatandas Sawlani (24.8%)
Prakashchand Sandh (3.98%)
22.53%
Quarterly Results Snapshot (Standalone) - Mar'26 - YoY

YoY Growth in quarter ended Mar 2026 is -78.42% vs 460.47% in Mar 2025
YoY Growth in quarter ended Mar 2026 is -612.50% vs 14.29% in Mar 2025
Half Yearly Results Snapshot (Standalone) - Sep'25

Growth in half year ended Sep 2025 is 40.42% vs 0.00% in Sep 2024
Growth in half year ended Sep 2025 is -41.67% vs 271.43% in Sep 2024
Nine Monthly Results Snapshot (Standalone) - Dec'25
YoY Growth in nine months ended Dec 2025 is -36.64% vs 0.00% in Dec 2024
YoY Growth in nine months ended Dec 2025 is -513.64% vs 269.23% in Dec 2024
Annual Results Snapshot (Standalone) - Mar'26
YoY Growth in year ended Mar 2026 is -51.56% vs 1,469.77% in Mar 2025
YoY Growth in year ended Mar 2026 is -522.58% vs 616.67% in Mar 2025
About Shantai Industries Ltd


