Dashboard
With a growth in Operating Profit of 46.41%, the company declared Very Positive results in Mar 26
- NET SALES(Q) Highest at Rs 1,996.30 cr
- PBDIT(Q) Highest at Rs 69.73 cr.
- OPERATING PROFIT TO NET SALES(Q) Highest at 3.49%
With ROE of 23.7, it has a Very Attractive valuation with a 4.7 Price to Book Value
High Institutional Holdings at 23.1%
Total Returns (Price + Dividend) 
Shankara Buildpr for the last several years.
Risk Adjusted Returns v/s
Returns Beta

News

Shankara Buildpro Ltd Upgraded to Strong Buy on Robust Financial and Quality Metrics
Shankara Buildpro Ltd has been upgraded to a Strong Buy rating with a Mojo Score of 80.0, reflecting significant improvements across financial performance, quality metrics, valuation, and technical indicators. This upgrade, effective from 20 May 2026, marks a notable shift in the company’s investment appeal within the retailing sector, driven by its exceptional quarterly results and favourable market positioning.
Read More
Shankara Buildpro Ltd Valuation Shifts to Very Attractive Amid Strong Financial Metrics
Shankara Buildpro Ltd has witnessed a significant shift in its valuation parameters, moving from an attractive to a very attractive grade, signalling enhanced price appeal for investors. This change comes amid a backdrop of robust financial metrics and a competitive retailing sector landscape, positioning the small-cap company favourably against its peers.
Read More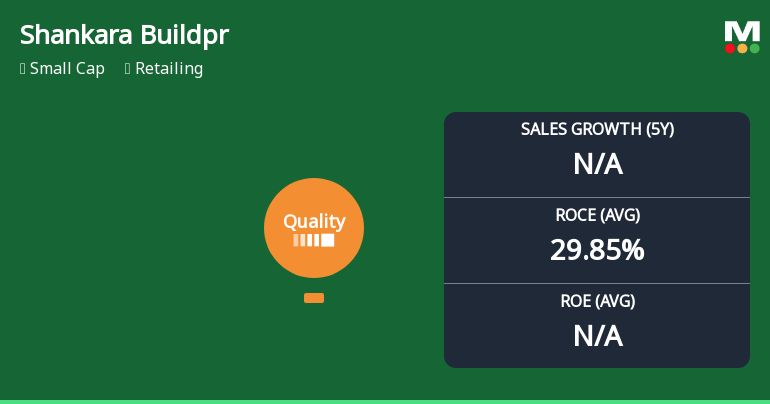
Shankara Buildpro Ltd Upgraded to Strong Buy on Improved Quality Metrics
Shankara Buildpro Ltd has been upgraded to a Strong Buy rating with a mojo score of 80.0, reflecting significant improvements in its business fundamentals and quality parameters. The company’s enhanced return ratios, conservative debt profile, and consistent operational efficiency have driven this positive reassessment, positioning it favourably within the retailing sector.
Read More Announcements
Announcement under Regulation 30 (LODR)-Newspaper Publication
12-Jun-2026 | Source : BSENewspaper Publication-AGM Notice
Reg. 34 (1) Annual Report.
10-Jun-2026 | Source : BSEAnnual Report
Notice Of 3Rd Annual General Meeting
10-Jun-2026 | Source : BSEWe wish to inform that the 3rd Annual General Meeting of the Members of the Company will be held on Thursday July 2 2026 at 11.30 A.M through Video Conferencing (VC) / Other Audio Visual Means (OAVM)
Corporate Actions

No Upcoming Board Meetings

Shankara Buildpro Ltd has declared 50% dividend, ex-date: 24 Jun 26

No Splits history available

No Bonus history available

No Rights history available
Quality key factors
Valuation key factors
Technicals key factors
 Technical Indicator Scale: Bearish, Mildly Bearish, Sideways, Mildly Bullish, Bullish Turned
 Shareholding Snapshot : Mar 2026
Shareholding Compare (%holding)
Promoters
None
Held by 1 Schemes (4.66%)
Held by 57 FIIs (10.97%)
Sukumar Srinivas (38.72%)
Franklin India Small Cap Fund (4.66%)
24.85%
Quarterly Results Snapshot (Standalone) - Mar'26 - QoQ

QoQ Growth in quarter ended Mar 2026 is 19.81% vs 4.34% in Dec 2025
QoQ Growth in quarter ended Mar 2026 is 65.68% vs -15.35% in Dec 2025
Annual Results Snapshot (Standalone) - Mar'26
Not Applicable: The company has declared_date for only one period
Not Applicable: The company has declared_date for only one period


