Dashboard
Company has a low Debt to Equity ratio (avg) at 0.14 times
- PAT(Latest six months) At Rs 3.67 cr has Grown at 58.19%
Stock is technically in a Bullish range
With ROCE of 6.5, it has a Very Attractive valuation with a 0.6 Enterprise value to Capital Employed
Majority shareholders : Non Institution
Total Returns (Price + Dividend) 
Scan Steels for the last several years.
Risk Adjusted Returns v/s
Returns Beta

News
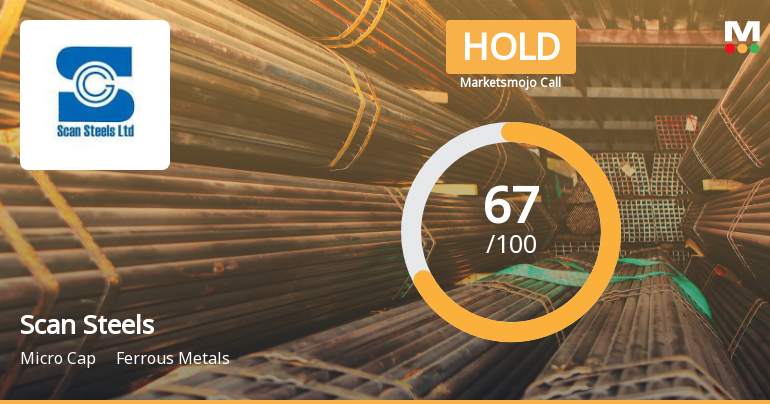
Scan Steels Ltd Upgraded to Hold as Financials and Valuation Improve
Scan Steels Ltd has seen its investment rating upgraded from Sell to Hold, reflecting significant improvements across financial performance, valuation metrics, quality indicators, and technical trends. This upgrade, effective from 18 May 2026, is underpinned by robust quarterly results, attractive valuation multiples, and a shift towards a more bullish technical outlook, positioning the micro-cap steel company favourably within the ferrous metals sector.
Read More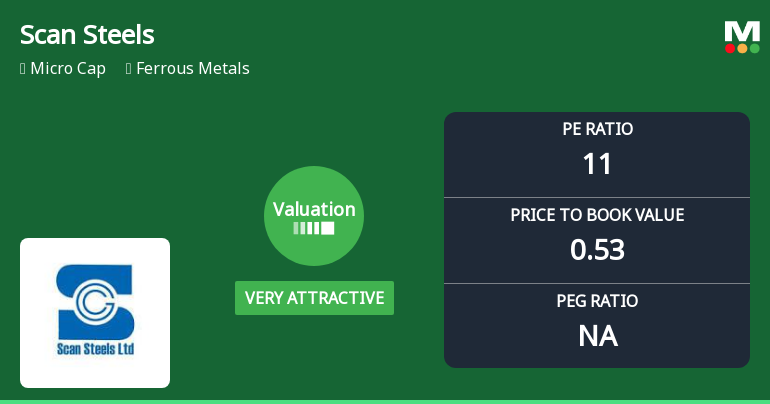
Scan Steels Ltd Valuation Shifts to Very Attractive Amid Market Rally
Scan Steels Ltd has witnessed a significant improvement in its valuation parameters, shifting from an attractive to a very attractive rating. This change is underpinned by a notable decline in its price-to-earnings (P/E) and price-to-book value (P/BV) ratios, positioning the micro-cap ferrous metals company as a compelling option within its sector despite mixed returns against benchmark indices.
Read More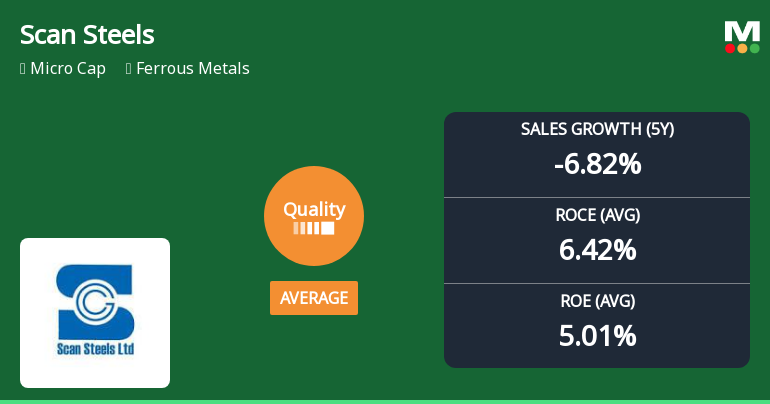
Scan Steels Ltd Quality Grade Upgrade Reflects Mixed Business Fundamentals
Scan Steels Ltd has seen its quality grade upgraded from below average to average, reflecting a nuanced shift in its business fundamentals. While certain metrics such as return on capital employed (ROCE) and return on equity (ROE) remain modest, improvements in debt management and interest coverage have contributed to a more balanced outlook. This article analyses the key financial parameters underpinning this change and what it means for investors navigating the ferrous metals sector.
Read More Announcements
Announcement under Regulation 30 (LODR)-Newspaper Publication
16-May-2026 | Source : BSENewspaper publication of Audited Standalone and Consolidated Financial Results of the Company for the quarter & year ended March 31 2026.
Compliances-Reg.24(A)-Annual Secretarial Compliance
09-May-2026 | Source : BSEAnnual Secretarial Compliance Report for the Financial Year ended March 31 2026.
Board Meeting Intimation for The Meeting Of The Board Of Directors Of The Company Is Scheduled To Be Held On Friday May 15 2026 At Trishna Nirmalaya Bhawan Plot No. - 516/1723/3991 3Rd Floor Magnetics Square Patia Bhubaneswar - 751024 (Odisha) At 4.00 P.M
04-May-2026 | Source : BSEScan Steels Ltdhas informed BSE that the meeting of the Board of Directors of the Company is scheduled on 15/05/2026 inter alia to consider and approve 1. Audited Standalone and Consolidated Financial Results of the Company for the Quarter and Financial Year ended March 31 2026 along with the Audit Report as per Regulation 33 of the SEBI (Listing Obligations and Disclosure Requirements) Regulations 2015; 2. Discuss any other business matter if required with the permission of Chair.
Corporate Actions

No Upcoming Board Meetings

No Dividend history available

No Splits history available

No Bonus history available

No Rights history available
Quality key factors
Valuation key factors
Technicals key factors
 Technical Indicator Scale: Bearish, Mildly Bearish, Sideways, Mildly Bullish, Bullish Turned
 Shareholding Snapshot : Mar 2026
Shareholding Compare (%holding)
Non Institution
None
Held by 0 Schemes
Held by 1 FIIs (2.05%)
Artline Commerce Private Limited (16.33%)
Gopikar Supply Pvt Ltd (5.85%)
17.96%
Quarterly Results Snapshot (Consolidated) - Dec'25 - QoQ

QoQ Growth in quarter ended Dec 2025 is 44.13% vs -42.69% in Sep 2025
QoQ Growth in quarter ended Dec 2025 is 1,731.58% vs -98.19% in Sep 2025
Half Yearly Results Snapshot (Consolidated) - Sep'25
Growth in half year ended Sep 2025 is -2.29% vs -23.61% in Sep 2024

Growth in half year ended Sep 2025 is -22.25% vs 70.81% in Sep 2024
Nine Monthly Results Snapshot (Consolidated) - Dec'25
YoY Growth in nine months ended Dec 2025 is 1.57% vs -22.64% in Dec 2024
YoY Growth in nine months ended Dec 2025 is -16.20% vs 75.78% in Dec 2024
Annual Results Snapshot (Consolidated) - Mar'25
YoY Growth in year ended Mar 2025 is -18.25% vs -11.49% in Mar 2024
YoY Growth in year ended Mar 2025 is 2.85% vs 37.40% in Mar 2024
About Scan Steels Ltd


