Stock DNA
Computers - Software & Consulting
INR 47 Cr (Micro Cap)
13.00
21
3.59%
-0.24
15.40%
2.10
Total Returns (Price + Dividend) 
Latest dividend: 1.4945317840054682 per share ex-dividend date: Feb-16-2026
Risk Adjusted Returns v/s
Returns Beta

News

Saven Technologies Ltd Upgraded to Sell on Improved Technicals and Valuation
Saven Technologies Ltd, a micro-cap player in the Computers - Software & Consulting sector, has seen its investment rating upgraded from Strong Sell to Sell as of 19 May 2026. This change reflects a nuanced improvement across technical indicators and valuation metrics, despite ongoing challenges in financial trends and quality assessments. The company’s current Mojo Score stands at 37.0, signalling a cautious but less negative outlook compared to its previous standing.
Read More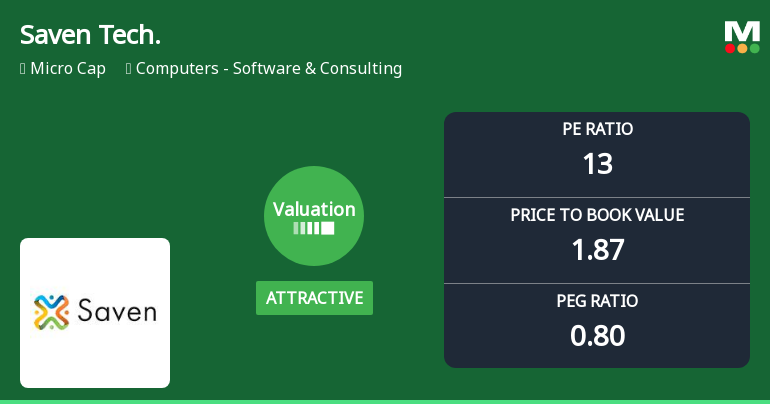
Saven Technologies Ltd Valuation Shifts Signal Improved Price Attractiveness
Saven Technologies Ltd, a micro-cap player in the Computers - Software & Consulting sector, has seen a notable improvement in its valuation parameters, shifting from very attractive to attractive. Despite a challenging year-to-date performance relative to the Sensex, the company’s price-to-earnings (P/E) and price-to-book value (P/BV) ratios suggest a more compelling entry point for investors seeking value in a volatile market.
Read More
Saven Technologies Ltd is Rated Sell
Saven Technologies Ltd is rated 'Sell' by MarketsMOJO, with this rating last updated on 02 Mar 2026. However, the analysis and financial metrics discussed here reflect the stock's current position as of 08 May 2026, providing investors with an up-to-date view of the company’s performance and outlook.
Read More Announcements
Announcement under Regulation 30 (LODR)-Newspaper Publication
23-May-2026 | Source : BSEAttached
Regulation-30-Intimation
22-May-2026 | Source : BSEAttached
Results
22-May-2026 | Source : BSEAttached
Corporate Actions

No Upcoming Board Meetings

Saven Technologies Ltd has declared 150% dividend, ex-date: 16 Feb 26

No Splits history available

No Bonus history available

No Rights history available
Quality key factors
Valuation key factors
Technicals key factors
 Technical Indicator Scale: Bearish, Mildly Bearish, Sideways, Mildly Bullish, Bullish Turned
 Shareholding Snapshot : Mar 2026
Shareholding Compare (%holding)
Non Institution
None
Held by 0 Schemes
Held by 0 FIIs
J. Rajyalakshmi (21.35%)
Dhari Mohammad Al-roomi (7.81%)
45.25%
Quarterly Results Snapshot (Standalone) - Mar'26 - YoY

YoY Growth in quarter ended Mar 2026 is 35.36% vs 12.80% in Mar 2025
YoY Growth in quarter ended Mar 2026 is 63.83% vs -17.54% in Mar 2025
Half Yearly Results Snapshot (Standalone) - Sep'25
Growth in half year ended Sep 2025 is 37.76% vs 2.45% in Sep 2024
Growth in half year ended Sep 2025 is 56.62% vs 21.43% in Sep 2024
Nine Monthly Results Snapshot (Standalone) - Dec'25
YoY Growth in nine months ended Dec 2025 is 31.11% vs 7.14% in Dec 2024
YoY Growth in nine months ended Dec 2025 is 25.47% vs 9.84% in Dec 2024
Annual Results Snapshot (Standalone) - Mar'26
YoY Growth in year ended Mar 2026 is 32.17% vs 8.58% in Mar 2025
YoY Growth in year ended Mar 2026 is 32.05% vs 4.02% in Mar 2025
About Saven Technologies Ltd


