Dashboard
Weak Long Term Fundamental Strength with a -6.89% CAGR growth in Operating Profits over the last 5 years
- Company's ability to service its debt is weak with a poor EBIT to Interest (avg) ratio of 0.43
- The company has been able to generate a Return on Equity (avg) of 5.10% signifying low profitability per unit of shareholders funds
Flat results in Dec 25
Risky - Negative Operating Profits
Despite the size of the company, domestic mutual funds hold only 0% of the company
Stock DNA
Auto Components & Equipments
INR 1,200 Cr (Micro Cap)
1,707.00
36
0.00%
0.46
0.34%
65.08
Total Returns (Price + Dividend) 
Sar Auto Prod. for the last several years.
Risk Adjusted Returns v/s
Returns Beta

News
Sar Auto Products Ltd is Rated Sell
Sar Auto Products Ltd is rated 'Sell' by MarketsMOJO, with this rating last updated on 27 Mar 2026. However, the analysis and financial metrics discussed here reflect the company’s current position as of 13 May 2026, providing investors with the latest insights into its fundamentals, valuation, financial trends, and technical outlook.
Read More
Sar Auto Products Ltd Sees Mixed Technical Signals Amid Price Momentum Shift
Sar Auto Products Ltd, a micro-cap player in the Auto Components & Equipments sector, has experienced a notable shift in its technical momentum, moving from a bullish to a mildly bullish trend. Despite a recent day decline of 4.99%, the stock’s mixed technical indicators and strong long-term returns relative to the Sensex warrant a detailed analysis for investors seeking clarity on its near-term prospects.
Read More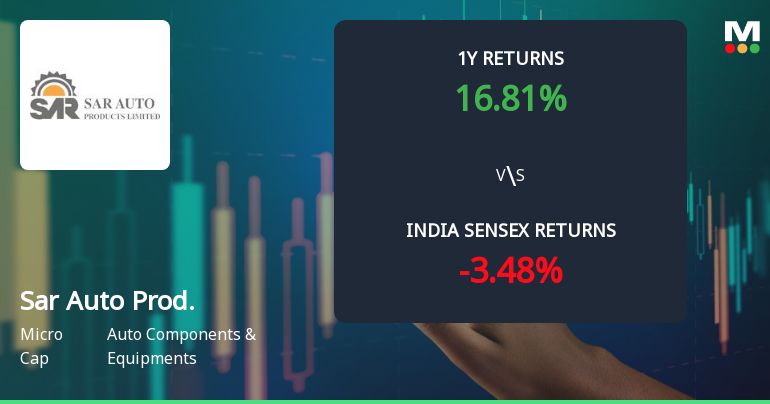
Sar Auto Products Ltd Sees Bullish Momentum Shift Amid Technical Upgrades
Sar Auto Products Ltd has exhibited a notable shift in technical momentum, moving from a mildly bullish stance to a more confident bullish trend across key indicators. This transition is underscored by positive signals from MACD, moving averages, and Bollinger Bands, suggesting renewed investor interest and potential upside in the micro-cap auto components stock.
Read More Announcements
Announcement under Regulation 30 (LODR)-Newspaper Publication
27-May-2026 | Source : BSESubmission of Newspaper Copy - Publication of Audited Standalone Financial Results For The Quarter And Year Ended On 31st March 2026.
Results - Financial Results For The Quarter And Year Ended On 31/03/2026
26-May-2026 | Source : BSESubmission of Audited Financial Results for the Quarter and year ended on March 31 2026 - Outcome of the Board Meeting held on Tuesday May 26 2026
Board Meeting Outcome for Submission Of Audited Financial Results For The Quarter And Year Ended On March 31 2026- Outcome Of The Board Meeting Held On Tuesday May 26 2026.
26-May-2026 | Source : BSESubmission of Audited Financial Results for the quarter and year ended on March 31 2026- Outcome of the Board Meeting held on Tuesday May 26 2026.
Corporate Actions

No Upcoming Board Meetings

No Dividend history available

No Splits history available

No Bonus history available

No Rights history available
Quality key factors
Valuation key factors
Technicals key factors
 Technical Indicator Scale: Bearish, Mildly Bearish, Sideways, Mildly Bullish, Bullish Turned
 Shareholding Snapshot : Mar 2026
Shareholding Compare (%holding)
Promoters
None
Held by 0 Schemes
Held by 0 FIIs
Urvi Shreyas Virani (28.68%)
Gujarat State Financial Corporation (4.63%)
9.48%
Quarterly Results Snapshot (Standalone) - Mar'26 - QoQ

QoQ Growth in quarter ended Mar 2026 is 69.83% vs 48.55% in Dec 2025

QoQ Growth in quarter ended Mar 2026 is -4.76% vs 50.00% in Dec 2025
Half Yearly Results Snapshot (Standalone) - Sep'25
Growth in half year ended Sep 2025 is -42.51% vs -9.35% in Sep 2024
Growth in half year ended Sep 2025 is -57.38% vs -16.44% in Sep 2024
Nine Monthly Results Snapshot (Standalone) - Dec'25
YoY Growth in nine months ended Dec 2025 is -29.16% vs -20.41% in Dec 2024
YoY Growth in nine months ended Dec 2025 is -38.16% vs -37.70% in Dec 2024
Annual Results Snapshot (Standalone) - Mar'26
YoY Growth in year ended Mar 2026 is 2.72% vs -30.29% in Mar 2025
YoY Growth in year ended Mar 2026 is 59.52% vs -64.10% in Mar 2025
About Sar Auto Products Ltd


