Dashboard
High Management Efficiency with a high ROCE of 15.24%
Healthy long term growth as Net Sales has grown by an annual rate of 27.00%
With a growth in Net Profit of 238.88%, the company declared Very Positive results in Mar 26
With ROCE of 18.2, it has a Fair valuation with a 2.7 Enterprise value to Capital Employed
Majority shareholders : Promoters
Stock DNA
Iron & Steel Products
INR 3,156 Cr (Small Cap)
22.00
26
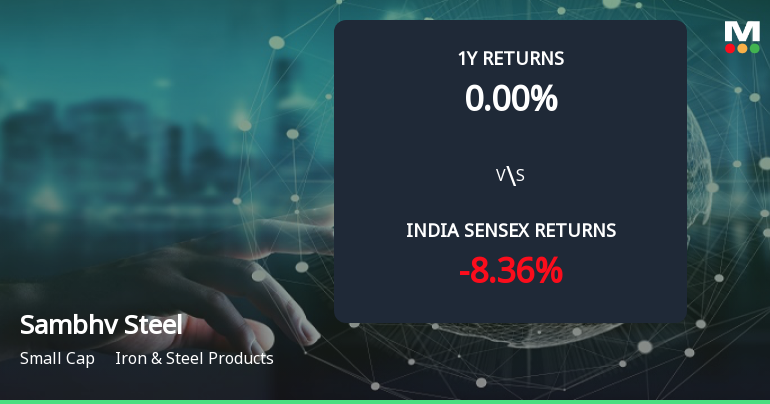
0.00%
0.21
5.94%
3.00
Total Returns (Price + Dividend) 
Sambhv Steel for the last several years.
Risk Adjusted Returns v/s
Returns Beta

News
Sambhv Steel Tubes Ltd Forms Golden Cross Amid Mixed Technical Signals
The 50-day moving average for Sambhv Steel Tubes Ltd has crossed above the 200-day moving average, creating a golden cross on 19 May 2026. While this technical event often signals a shift towards bullish momentum, the broader technical and fundamental context presents a more nuanced picture that warrants careful analysis.
Read More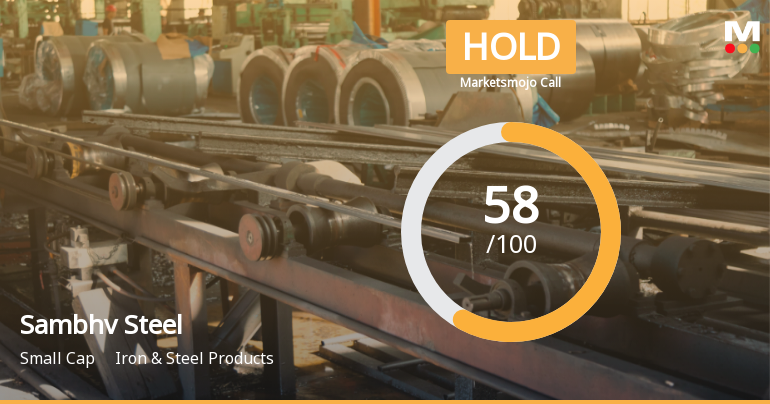
Sambhv Steel Tubes Ltd Downgraded to Hold Amid Mixed Technical and Valuation Signals
Sambhv Steel Tubes Ltd, a small-cap player in the Iron & Steel Products sector, has seen its investment rating downgraded from Buy to Hold as of 18 May 2026. This revision reflects a combination of shifting technical indicators, a reassessment of valuation metrics, and evolving financial trends, signalling a more cautious stance for investors despite the company’s robust operational performance.
Read More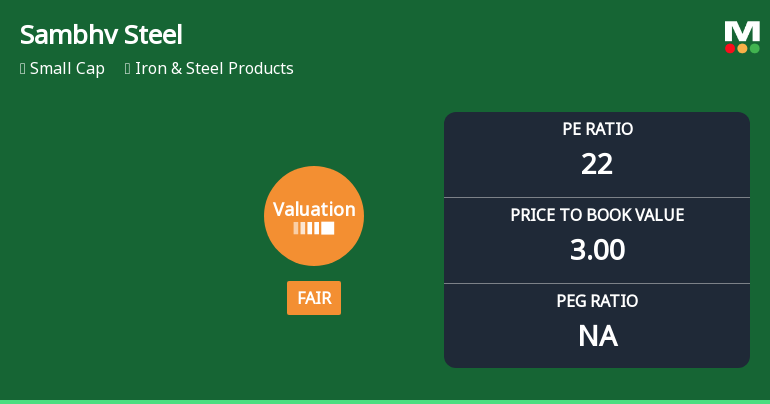
Sambhv Steel Tubes Ltd Valuation Shifts Amid Market Volatility
Sambhv Steel Tubes Ltd, a small-cap player in the Iron & Steel Products sector, has witnessed a notable shift in its valuation parameters, moving from an expensive to a fair rating. This change comes amid a sharp price correction and evolving market dynamics, prompting a reassessment of its price-to-earnings (P/E) and price-to-book value (P/BV) multiples relative to historical averages and peer benchmarks.
Read More Announcements
Announcement under Regulation 30 (LODR)-Newspaper Publication
10-Jun-2026 | Source : BSESambhv Steel Tubes Limited informed the Exchanges about Newspaper Publication regarding dispatch of postal ballot notice and e-voting matters.
Shareholder Meeting / Postal Ballot-Notice of Postal Ballot
09-Jun-2026 | Source : BSESambhv Steel Tubes Limited has informed exchange regarding the Notice of Postal Ballot dated June 09 2026
Announcement under Regulation 30 (LODR)-Analyst / Investor Meet - Intimation
04-Jun-2026 | Source : BSEWe wish to inform you that pursuant to Regulation 30 of the SEBI (LODR) Regulations 2015 we hereby disclose the schedule of the Analyst/ Institutional Investor meeting with the company to be held on June 10 2026
Corporate Actions

No Upcoming Board Meetings

No Dividend history available

No Splits history available

No Bonus history available

No Rights history available
Quality key factors
Valuation key factors
Technicals key factors
 Technical Indicator Scale: Bearish, Mildly Bearish, Sideways, Mildly Bullish, Bullish Turned
 Shareholding Snapshot : Mar 2026
Shareholding Compare (%holding)
Promoters
None
Held by 2 Schemes (1.41%)
Held by 9 FIIs (1.52%)
Suman Goyal (6.49%)
Archana Goyal (6.48%)
31.92%
Quarterly Results Snapshot (Standalone) - Mar'26 - QoQ

QoQ Growth in quarter ended Mar 2026 is 16.32% vs 1.55% in Dec 2025
QoQ Growth in quarter ended Mar 2026 is 131.16% vs -19.49% in Dec 2025
Half Yearly Results Snapshot (Standalone) - Sep'25
Not Applicable: The company has declared_date for only one period
Not Applicable: The company has declared_date for only one period
Nine Monthly Results Snapshot (Standalone) - Dec'25
Not Applicable: The company has declared_date for only one period
Not Applicable: The company has declared_date for only one period
Annual Results Snapshot (Standalone) - Mar'26
YoY Growth in year ended Mar 2026 is 59.67% vs 17.55% in Mar 2025
YoY Growth in year ended Mar 2026 is 146.85% vs -29.60% in Mar 2025
About Sambhv Steel Tubes Ltd

Company Coordinates