Dashboard
Weak Long Term Fundamental Strength with an average Return on Capital Employed (ROCE) of 5.65%
- Poor long term growth as Net Sales has grown by an annual rate of 5.98% and Operating profit at -1.02% over the last 5 years
- Low ability to service debt as the company has a high Debt to EBITDA ratio of 11.53 times
Negative results in Mar 26
Stock is technically in a Mildly Bearish range
Consistent Underperformance against the benchmark over the last 3 years
Stock DNA
Garments & Apparels
INR 47 Cr (Micro Cap)
NA (Loss Making)
24
0.00%
1.44
-5.21%
0.61
Total Returns (Price + Dividend) 
Latest dividend: 5 per share ex-dividend date: Sep-15-2022
Risk Adjusted Returns v/s
Returns Beta

News
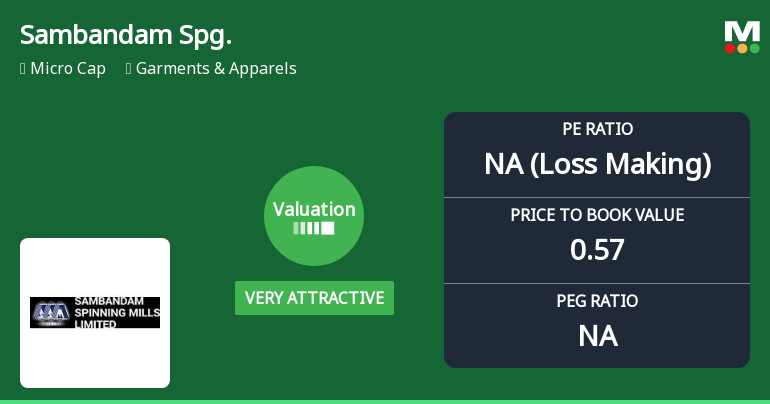
Sambandam Spinning Mills Ltd Valuation Shifts Signal Renewed Price Attractiveness
Sambandam Spinning Mills Ltd has seen a notable shift in its valuation parameters, moving from an attractive to a very attractive rating despite ongoing challenges in profitability and returns. This recalibration comes amid a backdrop of subdued stock performance relative to benchmarks and a micro-cap status that continues to weigh on investor sentiment.
Read More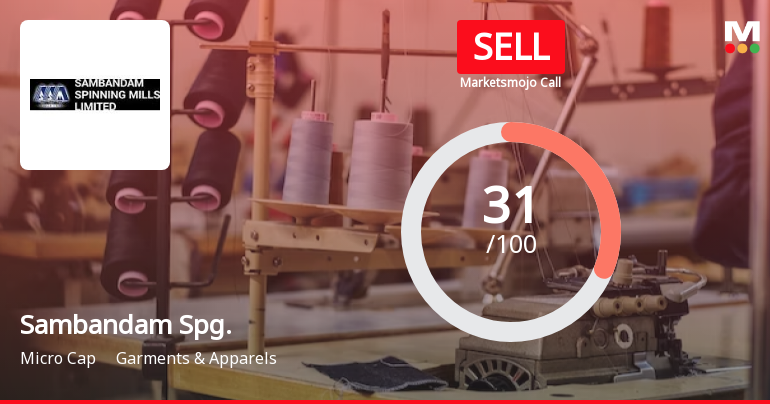
Sambandam Spinning Mills Ltd is Rated Sell
Sambandam Spinning Mills Ltd is rated 'Sell' by MarketsMOJO, with this rating last updated on 10 April 2026. However, the analysis and financial metrics discussed here reflect the stock's current position as of 27 April 2026, providing investors with an up-to-date view of the company's fundamentals, returns, and market standing.
Read More
Sambandam Spinning Mills Ltd Upgraded to Sell on Technical Improvements Despite Weak Fundamentals
Sambandam Spinning Mills Ltd has seen its investment rating upgraded from Strong Sell to Sell, reflecting a nuanced shift in its technical outlook despite persistent fundamental challenges. The upgrade, effective from 10 April 2026, is primarily driven by improvements in technical indicators, while valuation and financial trends remain mixed. This article analyses the four key parameters—Quality, Valuation, Financial Trend, and Technicals—that influenced the rating change and what it means for investors navigating the Garments & Apparels sector.
Read More Announcements
Compliances-Reg.24(A)-Annual Secretarial Compliance
29-May-2026 | Source : BSEAnnual Secretarial Compliance Report for 2025-26
Board Meeting Outcome for Audited Financial Results For The Quarter And Year Ended 31.03.2026
23-May-2026 | Source : BSEAudited Financial Results for the quarter and year ended 31.03.2026
Audited Financial Results For The Quarter And Year Ended 31.03.2026
23-May-2026 | Source : BSEAudited Financial Results for the quarter and year ended 31.03.2026
Corporate Actions

No Upcoming Board Meetings

Sambandam Spinning Mills Ltd has declared 50% dividend, ex-date: 15 Sep 22

No Splits history available

No Bonus history available

No Rights history available
Quality key factors
Valuation key factors
Technicals key factors
 Technical Indicator Scale: Bearish, Mildly Bearish, Sideways, Mildly Bullish, Bullish Turned
 Shareholding Snapshot : Mar 2026
Shareholding Compare (%holding)
Promoters
None
Held by 0 Schemes
Held by 0 FIIs
Devarajan Sambandam (14.69%)
Shivani Tejas Trivedi (4.65%)
44.91%
Quarterly Results Snapshot (Consolidated) - Mar'26 - QoQ

QoQ Growth in quarter ended Mar 2026 is 4.09% vs -1.95% in Dec 2025
QoQ Growth in quarter ended Mar 2026 is -37.04% vs -103.77% in Dec 2025
Half Yearly Results Snapshot (Consolidated) - Sep'25

Growth in half year ended Sep 2025 is -8.31% vs 37.81% in Sep 2024
Growth in half year ended Sep 2025 is 83.97% vs -22.94% in Sep 2024
Nine Monthly Results Snapshot (Consolidated) - Dec'25
YoY Growth in nine months ended Dec 2025 is -3.63% vs 30.05% in Dec 2024
YoY Growth in nine months ended Dec 2025 is 64.06% vs -15.47% in Dec 2024
Annual Results Snapshot (Consolidated) - Mar'26
YoY Growth in year ended Mar 2026 is -1.80% vs 23.11% in Mar 2025
YoY Growth in year ended Mar 2026 is 22.86% vs 6.37% in Mar 2025
About Sambandam Spinning Mills Ltd


