Dashboard
With a Operating Losses, the company has a Weak Long Term Fundamental Strength
- Company's ability to service its debt is weak with a poor EBIT to Interest (avg) ratio of -0.86
Negative results in Dec 25
With ROCE of 0.8, it has a Very Expensive valuation with a 0.6 Enterprise value to Capital Employed
Stock DNA
Construction
INR 230 Cr (Micro Cap)
NA (Loss Making)
33
0.00%
0.13
1.01%
0.70
Total Returns (Price + Dividend) 
SAB Industries for the last several years.
Risk Adjusted Returns v/s
Returns Beta

News

SAB Industries Ltd is Rated Strong Sell
SAB Industries Ltd is rated Strong Sell by MarketsMOJO, with this rating last updated on 15 Nov 2025. However, the analysis and financial metrics discussed here reflect the company’s current position as of 12 May 2026, providing investors with the latest insights into its performance and outlook.
Read More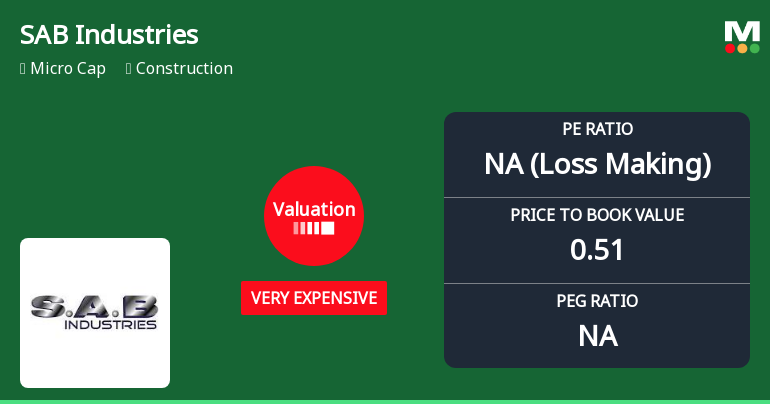
SAB Industries Ltd Valuation Shifts to 'Very Expensive' Amid Mixed Market Performance
SAB Industries Ltd, a micro-cap player in the construction sector, has witnessed a significant shift in its valuation parameters, moving from a risky to a very expensive classification. Despite a robust year-to-date return of 21.15%, outperforming the Sensex by over 30 percentage points, the company’s price-to-earnings (P/E) ratio and other valuation metrics suggest a stretched price level that warrants cautious investor scrutiny.
Read More
SAB Industries Ltd is Rated Strong Sell
SAB Industries Ltd is rated Strong Sell by MarketsMOJO, with this rating last updated on 15 Nov 2025. However, the analysis and financial metrics discussed here reflect the stock's current position as of 20 April 2026, providing investors with an up-to-date view of the company’s fundamentals, valuation, financial trends, and technical outlook.
Read More Announcements
Announcement under Regulation 30 (LODR)-Newspaper Publication
30-May-2026 | Source : BSENewspaper cutting of extract of audited financial results for the quarter and year ended 31.03.2026.
Board Meeting Outcome for Outcome Of Board Meeting Held On 29.05.2026
29-May-2026 | Source : BSEOutcome of Board Meeting held on 29.05.2026
Standalone & Consolidated Audited Financial Results For The Quarter And Year Ended 31.03.2026
29-May-2026 | Source : BSEStandalone and consolidated audited financial results for the quarter and year ended 31.03.2026 alongwith audit report.
Corporate Actions

No Upcoming Board Meetings

No Dividend history available

No Splits history available

No Bonus history available

No Rights history available
Quality key factors
Valuation key factors
Technicals key factors
 Technical Indicator Scale: Bearish, Mildly Bearish, Sideways, Mildly Bullish, Bullish Turned
 Shareholding Snapshot : Mar 2026
Shareholding Compare (%holding)
Promoters
None
Held by 6 Schemes (0.0%)
Held by 0 FIIs
Priya Garg (12.6%)
Bloomen Flora Limited (8.79%)
1.27%
Quarterly Results Snapshot (Consolidated) - Mar'26 - QoQ

QoQ Growth in quarter ended Mar 2026 is 198.82% vs -39.31% in Dec 2025

QoQ Growth in quarter ended Mar 2026 is 27.37% vs 36.65% in Dec 2025
Half Yearly Results Snapshot (Consolidated) - Sep'25
Growth in half year ended Sep 2025 is -38.81% vs 13.53% in Sep 2024
Growth in half year ended Sep 2025 is 1,219.71% vs -103.21% in Sep 2024
Nine Monthly Results Snapshot (Consolidated) - Dec'25
YoY Growth in nine months ended Dec 2025 is -46.68% vs 36.07% in Dec 2024
YoY Growth in nine months ended Dec 2025 is 187.49% vs -117.66% in Dec 2024
Annual Results Snapshot (Consolidated) - Mar'26
YoY Growth in year ended Mar 2026 is -35.39% vs 3.05% in Mar 2025
YoY Growth in year ended Mar 2026 is 90.19% vs -154.26% in Mar 2025
About SAB Industries Ltd


