Dashboard
Weak Long Term Fundamental Strength with an average Return on Capital Employed (ROCE) of 4.61%
- Poor long term growth as Net Sales has grown by an annual rate of 19.44% and Operating profit at 24.82% over the last 5 years
Flat results in Dec 25
Stock is technically in a Mildly Bearish range
With ROE of 4.3, it has a Expensive valuation with a 1 Price to Book Value
Underperformed the market in the last 1 year
Total Returns (Price + Dividend) 
Royale Manor for the last several years.
Risk Adjusted Returns v/s
Returns Beta

News
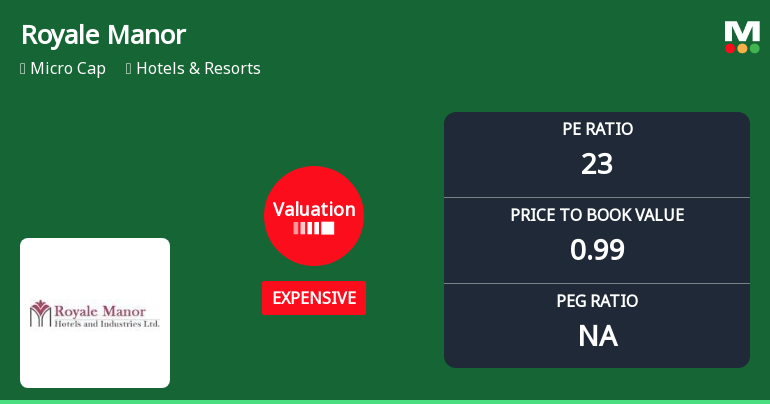
Royale Manor Hotels & Industries Ltd Valuation Shifts Signal Price Attractiveness Decline
Royale Manor Hotels & Industries Ltd has experienced a notable shift in its valuation parameters, moving from a fair to an expensive rating, raising questions about its price attractiveness amid a challenging market backdrop and underwhelming financial metrics.
Read More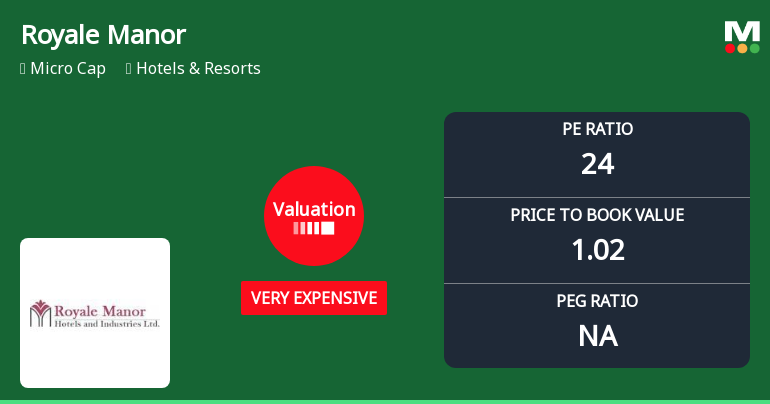
Royale Manor Hotels & Industries Ltd Valuation Shifts Signal Elevated Price Risk
Royale Manor Hotels & Industries Ltd has seen a marked shift in its valuation parameters, moving from fair to very expensive territory. Despite a modest day change of 0.22%, the stock’s price-to-earnings (P/E) ratio now stands at 23.66, signalling a significant premium relative to its historical averages and peer group. This re-rating comes amid subdued returns over the past year and a deteriorating quality grade, raising questions about the stock’s price attractiveness for investors in the Hotels & Resorts sector.
Read More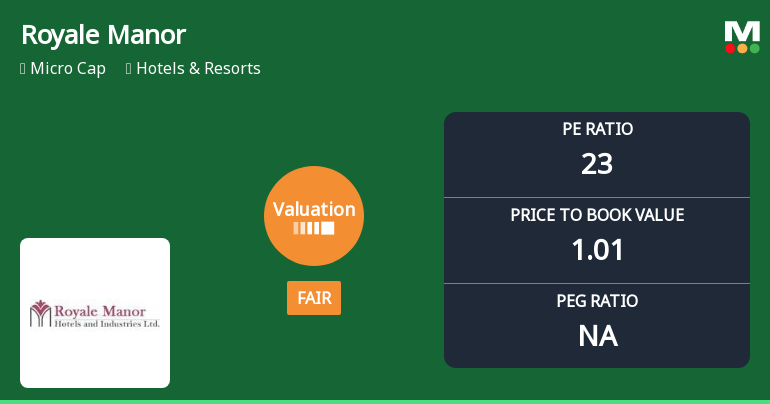
Royale Manor Hotels & Industries Ltd: Valuation Shifts Signal Price Attractiveness Amid Sector Challenges
Royale Manor Hotels & Industries Ltd has undergone a notable valuation recalibration, shifting from an expensive to a fair valuation grade. This adjustment, coupled with its current price movements and peer comparisons, offers investors a fresh perspective on the stock’s price attractiveness within the Hotels & Resorts sector.
Read More Announcements
Compliances-Reg.24(A)-Annual Secretarial Compliance
30-May-2026 | Source : BSEReg 24A
Reg 32
30-May-2026 | Source : BSEReg 32
Announcement under Regulation 30 (LODR)-Newspaper Publication
30-May-2026 | Source : BSENewspaper Publication of Financial Results
Corporate Actions

No Upcoming Board Meetings

No Dividend history available

No Splits history available

No Bonus history available

No Rights history available
Quality key factors
Valuation key factors
Technicals key factors
 Technical Indicator Scale: Bearish, Mildly Bearish, Sideways, Mildly Bullish, Bullish Turned
 Shareholding Snapshot : Mar 2026
Shareholding Compare (%holding)
Promoters
None
Held by 0 Schemes
Held by 0 FIIs
Shree Bala Finvest Private Limited. (15.31%)
Kailash Ramavatar Goenka (11.23%)
38.83%
Quarterly Results Snapshot (Standalone) - Mar'26 - YoY

YoY Growth in quarter ended Mar 2026 is -5.35% vs 7.16% in Mar 2025
YoY Growth in quarter ended Mar 2026 is -13.81% vs 17.53% in Mar 2025
Half Yearly Results Snapshot (Standalone) - Sep'25
Growth in half year ended Sep 2025 is -9.14% vs 6.06% in Sep 2024
Growth in half year ended Sep 2025 is -90.48% vs 6.78% in Sep 2024
Nine Monthly Results Snapshot (Standalone) - Dec'25

YoY Growth in nine months ended Dec 2025 is -2.42% vs -4.44% in Dec 2024
YoY Growth in nine months ended Dec 2025 is -34.88% vs -52.04% in Dec 2024
Annual Results Snapshot (Standalone) - Mar'26
YoY Growth in year ended Mar 2026 is -3.36% vs -0.98% in Mar 2025
YoY Growth in year ended Mar 2026 is -22.90% vs -26.54% in Mar 2025
About Royale Manor Hotels & Industries Ltd


