Dashboard
Low ability to service debt as the company has a high Debt to EBITDA ratio of 4.99 times
- Low ability to service debt as the company has a high Debt to EBITDA ratio of 4.99 times
Healthy long term growth as Net Sales has grown by an annual rate of 52.50% and Operating profit at 107.72%
The company has declared Positive results for the last 2 consecutive quarters
With ROCE of 12.9, it has a Attractive valuation with a 1.6 Enterprise value to Capital Employed
Rising Promoter Confidence
Stock DNA
Other Agricultural Products
INR 842 Cr (Micro Cap)
14.00
42
0.00%
0.67
10.41%
1.69
Total Returns (Price + Dividend) 
Regaal Resources for the last several years.
Risk Adjusted Returns v/s
Returns Beta

News

Regaal Resources Ltd Locks at Upper Circuit With 5% Gain — Buyers Queue, Sellers Absent
At Rs 83.26, the buying was done — not because demand dried up, but because the exchange wouldn't let the stock go any higher. Regaal Resources Ltd locked at its upper circuit of 5% on 21 May 2026, with buyers queuing and no sellers willing to part with shares.
Read More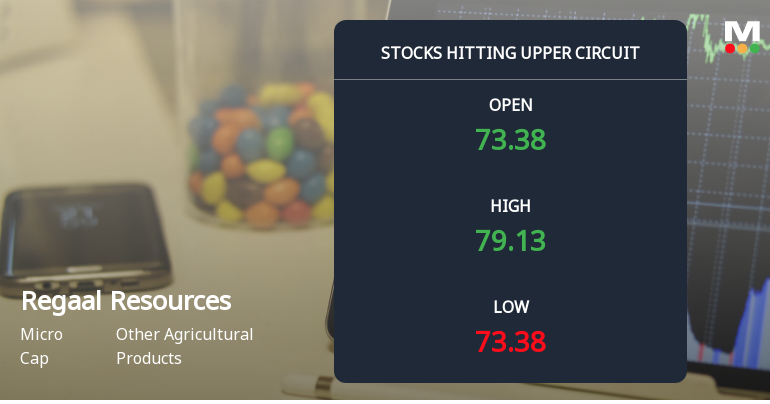
Regaal Resources Ltd Locks at Upper Circuit With 5% Gain — Buyers Queue, Sellers Absent
At Rs 78.64, the buying was done — not because demand dried up, but because the exchange wouldn't let the stock go any higher. Regaal Resources Ltd locked at its upper circuit of 4.99% on 19 May 2026, with buyers queuing and no sellers willing to part with shares.
Read More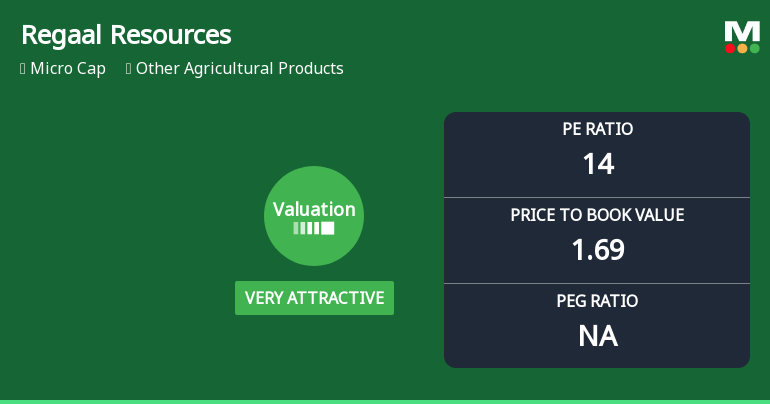
Regaal Resources Ltd Valuation Shifts to Very Attractive Amid Market Volatility
Regaal Resources Ltd, a micro-cap player in the Other Agricultural Products sector, has seen its valuation parameters improve significantly, shifting from an attractive to a very attractive rating. Despite a recent dip in share price, the company’s price-to-earnings (P/E) and price-to-book value (P/BV) ratios now present a compelling case for investors seeking value in a volatile market environment.
Read More Announcements
Announcement under Regulation 30 (LODR)-Earnings Call Transcript
03-Jun-2026 | Source : BSEPlease find enclosed Earnings Call Transcript for the quarter and financial year end March 31 2026
Announcement under Regulation 30 (LODR)-Newspaper Publication
28-May-2026 | Source : BSEPlease find enclosed clipping of Newspaper publication dated 28 May 2026
Announcement under Regulation 30 (LODR)-Analyst / Investor Meet - Outcome
28-May-2026 | Source : BSEPlease find enclosed the intimation for the Audio recording of Earnings Conference Call for the quarter and year ended March 31 2026.
Corporate Actions

No Upcoming Board Meetings

No Dividend history available

No Splits history available

No Bonus history available

No Rights history available
Quality key factors
Valuation key factors
Technicals key factors
 Technical Indicator Scale: Bearish, Mildly Bearish, Sideways, Mildly Bullish, Bullish Turned
 Shareholding Snapshot : Mar 2026
Shareholding Compare (%holding)
Promoters
None
Held by 1 Schemes (1.27%)
Held by 6 FIIs (0.34%)
Shruti Kishore Puria (27.48%)
Taurus Flexi Cap Fund (1.41%)
19.55%
Quarterly Results Snapshot (Standalone) - Mar'26 - QoQ

QoQ Growth in quarter ended Mar 2026 is -24.26% vs 0.92% in Dec 2025

QoQ Growth in quarter ended Mar 2026 is 24.83% vs -20.71% in Dec 2025
Half Yearly Results Snapshot (Standalone) - Sep'25
Not Applicable: The company has declared_date for only one period
Not Applicable: The company has declared_date for only one period
Nine Monthly Results Snapshot (Standalone) - Dec'25
Not Applicable: The company has declared_date for only one period
Not Applicable: The company has declared_date for only one period
Annual Results Snapshot (Standalone) - Mar'26
YoY Growth in year ended Mar 2026 is 23.93% vs 52.52% in Mar 2025
YoY Growth in year ended Mar 2026 is 16.55% vs 115.31% in Mar 2025
About Regaal Resources Ltd

Company Coordinates