Dashboard
Weak Long Term Fundamental Strength with a 12.31% CAGR growth in Net Sales over the last 5 years
- Low ability to service debt as the company has a high Debt to EBITDA ratio of 4.16 times
- The company has been able to generate a Return on Capital Employed (avg) of 5.43% signifying low profitability per unit of total capital (equity and debt)
- OPERATING PROFIT TO INTEREST(Q) Lowest at 2.87 times
- PAT(Q) At Rs 12.62 cr has Fallen at -47.1% (vs previous 4Q average)
- DEBT-EQUITY RATIO(HY) Highest at 1.19 times
Stock is technically in a Bearish range
With ROCE of 12.4, it has a Very Expensive valuation with a 3.2 Enterprise value to Capital Employed
Reducing Promoter Confidence
Stock DNA
Trading & Distributors
INR 2,881 Cr (Small Cap)
36.00
24
0.00%
0.82
21.05%
6.91
Total Returns (Price + Dividend) 
Latest dividend: 0.0100 per share ex-dividend date: Sep-06-2012
Risk Adjusted Returns v/s
Returns Beta

News
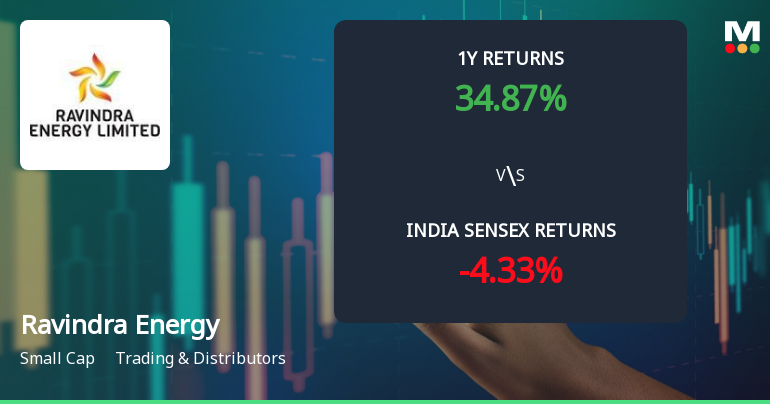
Ravindra Energy Ltd Faces Bearish Momentum Amid Technical Downgrade
Ravindra Energy Ltd, a small-cap player in the Trading & Distributors sector, has experienced a notable shift in its technical momentum, with key indicators signalling a bearish trend. Despite a strong long-term return profile, recent price action and technical parameters suggest caution for investors as the stock’s momentum deteriorates.
Read More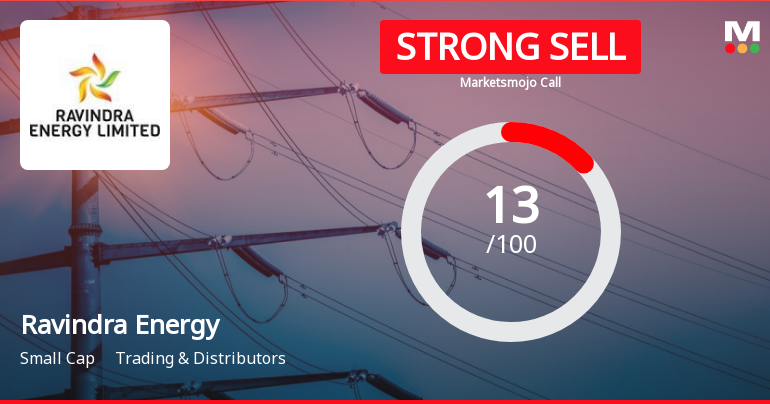
Ravindra Energy Ltd is Rated Strong Sell
Ravindra Energy Ltd is rated Strong Sell by MarketsMOJO, with this rating last updated on 05 Mar 2026. However, the analysis and financial metrics discussed here reflect the company’s current position as of 11 May 2026, providing investors with the latest insights into the stock’s fundamentals, valuation, financial trends, and technical outlook.
Read More
Ravindra Energy Ltd Technical Momentum Shifts Amid Mixed Market Signals
Ravindra Energy Ltd has experienced a nuanced shift in its technical momentum, with key indicators signalling a transition from bearish to mildly bearish trends. Despite a modest day gain of 0.76%, the stock’s technical parameters reveal a complex interplay of bullish and bearish signals across weekly and monthly timeframes, prompting a reassessment of its near-term outlook within the Trading & Distributors sector.
Read More Announcements
We Are Pleased To Release An Update Regarding Our Associate Company Energy In Motion Limited (EIM)
16-Jun-2026 | Source : BSEWe are pleased to release an update regarding our associate company Energy In Motion Limited (EIM)
Announcement under Regulation 30 (LODR)-Newspaper Publication
15-Jun-2026 | Source : BSEPlease find enclosed copy of newspaper publications on the corrigendum to the letter of offer dated June 12 2026.
Announcement under Regulation 30 (LODR)-Newspaper Publication
14-Jun-2026 | Source : BSEPlease find enclosed the copies of newspaper publications made in accordance with the provisions under Regulation 84 of the SEBI (Issue of Capital & Disclosure Requirements) Regulations 2018.
Corporate Actions

No Upcoming Board Meetings

Ravindra Energy Ltd has declared 10% dividend, ex-date: 06 Sep 12

No Splits history available

No Bonus history available

Ravindra Energy Ltd has announced 1:9 rights issue, ex-date: 08 Jun 26
Quality key factors
Valuation key factors
Technicals key factors
 Technical Indicator Scale: Bearish, Mildly Bearish, Sideways, Mildly Bullish, Bullish Turned
 Shareholding Snapshot : Mar 2026
Shareholding Compare (%holding)
Promoters
12.7516
Held by 2 Schemes (2.81%)
Held by 7 FIIs (1.98%)
Khandepar Investments Private Limited (34.65%)
Romarsol Limited (2.75%)
21.31%
Quarterly Results Snapshot (Consolidated) - Mar'26 - QoQ

QoQ Growth in quarter ended Mar 2026 is 4.63% vs 5.68% in Dec 2025

QoQ Growth in quarter ended Mar 2026 is -13.80% vs -52.45% in Dec 2025
Half Yearly Results Snapshot (Consolidated) - Sep'25
Growth in half year ended Sep 2025 is 639.04% vs -54.61% in Sep 2024
Growth in half year ended Sep 2025 is 694.96% vs -44.21% in Sep 2024
Nine Monthly Results Snapshot (Consolidated) - Dec'25
YoY Growth in nine months ended Dec 2025 is 348.59% vs -9.34% in Dec 2024
YoY Growth in nine months ended Dec 2025 is 664.80% vs -28.70% in Dec 2024
Annual Results Snapshot (Consolidated) - Mar'26
YoY Growth in year ended Mar 2026 is 116.92% vs 91.20% in Mar 2025
YoY Growth in year ended Mar 2026 is 270.61% vs 142.85% in Mar 2025
About Ravindra Energy Ltd


