Dashboard
High Debt Company with a Debt to Equity ratio (avg) at 1.70 times
- High Debt Company with a Debt to Equity ratio (avg) at 1.70 times
- The company has been able to generate a Return on Capital Employed (avg) of 7.38% signifying low profitability per unit of total capital (equity and debt)
Healthy long term growth as Net Sales has grown by an annual rate of 24.97% and Operating profit at 44.20%
With a growth in Net Profit of 21.1%, the company declared Very Positive results in Mar 26
Stock is technically in a Mildly Bullish range
With ROCE of 13.3, it has a Attractive valuation with a 2.2 Enterprise value to Capital Employed
Stock DNA
Auto Components & Equipments
INR 2,708 Cr (Small Cap)
25.00
36
0.81%
1.16
7.85%
3.62
Total Returns (Price + Dividend) 
Latest dividend: 8 per share ex-dividend date: Jul-29-2025
Risk Adjusted Returns v/s
Returns Beta

News
Rane (Madras) Ltd Technical Momentum Shifts Amid Mixed Indicator Signals
Rane (Madras) Ltd, a small-cap player in the Auto Components & Equipments sector, has experienced a notable shift in its technical momentum, moving from a mildly bullish stance to a sideways trend. Despite a slight dip in the daily price, the stock’s broader technical indicators present a complex picture, with bullish signals on weekly and monthly charts counterbalanced by some bearish tendencies, prompting a nuanced outlook for investors.
Read More
Rane (Madras) Ltd Technical Momentum Shifts Amid Mixed Indicator Signals
Rane (Madras) Ltd, a small-cap player in the Auto Components & Equipments sector, has experienced a notable shift in its technical momentum, moving from a mildly bullish stance to a sideways trend. Despite a recent downgrade in daily moving averages and mixed signals from key indicators such as MACD and KST, the stock continues to outperform the Sensex over multiple time horizons, prompting a reassessment of its medium-term outlook.
Read More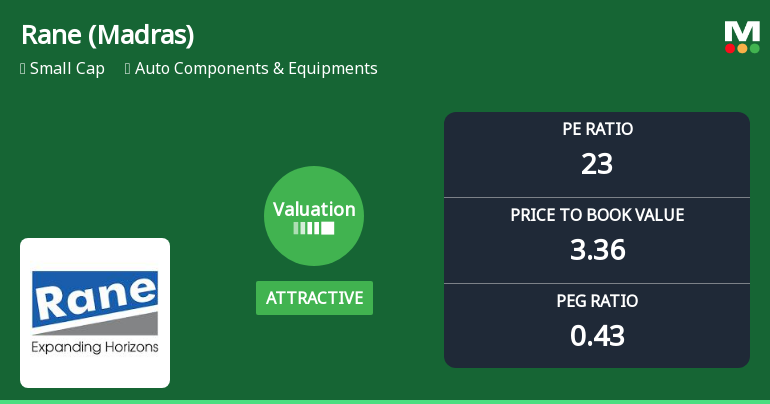
Rane (Madras) Ltd Valuation Shifts Signal Renewed Price Attractiveness
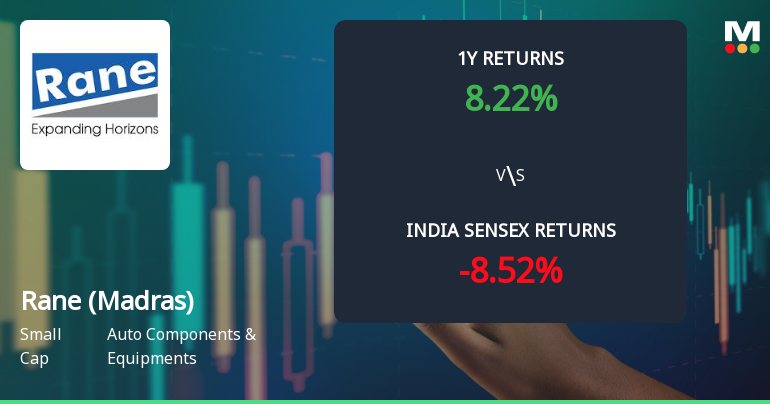
Rane (Madras) Ltd has witnessed a notable shift in its valuation parameters, moving from a fair to an attractive rating, supported by robust price-to-earnings and price-to-book value metrics. This re-rating comes alongside impressive stock returns that have outpaced the broader Sensex, signalling renewed investor interest in this small-cap auto components player.
Read More Announcements
Change In Senior Management Personnel (SMP) - Regulation 30 Of SEBI LODR
01-Jun-2026 | Source : BSEFurther to our letter no. RML/SE/141/2025-26 dated February 04 2026 intimating superannuation of Mr.T Giriprasad President - Aftermarket Products Business. We enclose copy of his letter intimating the same.
Newspaper Advertisement - Window For Re-Lodgement Of Transfer Requests For Physical Shares
26-May-2026 | Source : BSEBi-Monthly Newspaper Publication
Announcement under Regulation 30 (LODR)-Earnings Call Transcript
25-May-2026 | Source : BSEThe transcript of the earnings conference call is available in the investor information section of the website of the Company at the link: https://www.ranegroup.com/investors/rane-madras-limited-2/.
Corporate Actions

No Upcoming Board Meetings

Rane (Madras) Ltd has declared 160% dividend, ex-date: 29 Jul 26

No Splits history available

No Bonus history available

No Rights history available
Quality key factors
Valuation key factors
Technicals key factors
 Technical Indicator Scale: Bearish, Mildly Bearish, Sideways, Mildly Bullish, Bullish Turned
 Shareholding Snapshot : Dec 2025
Shareholding Compare (%holding)
Promoters
None
Held by 2 Schemes (0.06%)
Held by 10 FIIs (0.05%)
Rane Holdings Ltd (63.8%)
None
23.74%
Quarterly Results Snapshot (Consolidated) - Mar'26 - QoQ

QoQ Growth in quarter ended Mar 2026 is 3.22% vs 10.43% in Dec 2025
QoQ Growth in quarter ended Mar 2026 is 21.10% vs 42.15% in Dec 2025
Half Yearly Results Snapshot (Consolidated) - Sep'25
Growth in half year ended Sep 2025 is 7.97% vs 38.97% in Sep 2024
Growth in half year ended Sep 2025 is 30.08% vs 831.82% in Sep 2024
Nine Monthly Results Snapshot (Consolidated) - Dec'25
YoY Growth in nine months ended Dec 2025 is 12.40% vs 45.55% in Dec 2024
YoY Growth in nine months ended Dec 2025 is 126.46% vs 151.33% in Dec 2024
Annual Results Snapshot (Consolidated) - Mar'26

YoY Growth in year ended Mar 2026 is 13.42% vs -1.65% in Mar 2025
YoY Growth in year ended Mar 2026 is 185.47% vs -31.25% in Mar 2025
About Rane (Madras) Ltd


