Total Returns (Price + Dividend) 
Rajvi Logitrade for the last several years.
Risk Adjusted Returns v/s
Returns Beta

News

Broad-Based Technical Strength Lifts Rajvi Logitrade Ltd to 52-Week High of Rs 15.85
With a decisive surge to Rs 15.85 on 29 Apr 2026, Rajvi Logitrade Ltd has reached a fresh 52-week high, marking a 33.76% gain over the past year and outpacing the Sensex’s decline of 3.48%. This milestone reflects a strong alignment of technical indicators and sustained price momentum in the micro-cap transport services stock.
Read More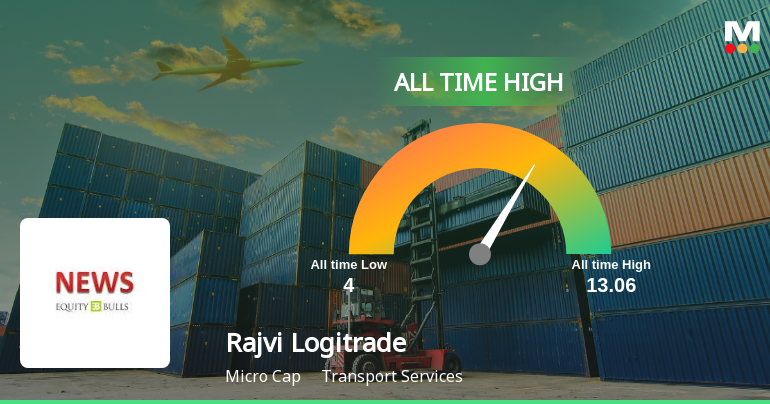
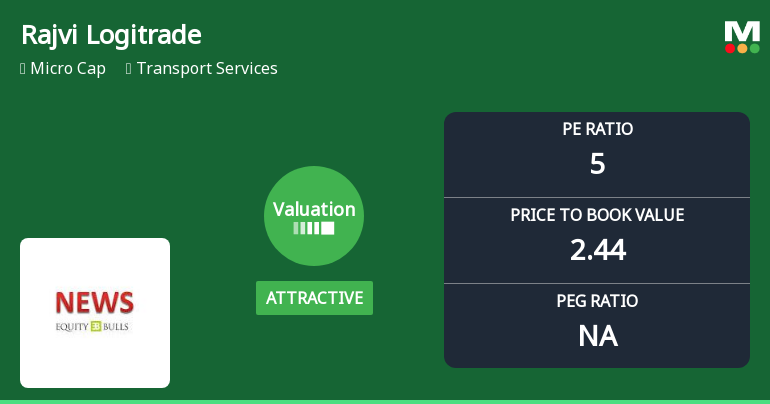
Rajvi Logitrade Ltd Valuation Shifts Signal Attractive Investment Opportunity
Rajvi Logitrade Ltd, a micro-cap player in the Transport Services sector, has recently undergone a significant shift in its valuation parameters, moving from a risky to an attractive grade. This change, underpinned by a notably low price-to-earnings (P/E) ratio and price-to-book value (P/BV), positions the stock as a compelling option for investors seeking value in a sector marked by volatility and competitive pressures.
Read More Announcements
Intimation Of Commercial Vehicle Lease Agreement Dated 01St June 2026
01-Jun-2026 | Source : BSEPursuant to Regulation 30 of SEBI (LODR) Regulations 2015 this is to inform that company has entered into commercial vehicle lease agreement with Mr. Bhupendrasinh Dalpatsinh Rana and M/S Rajvi Cargo Movers Private Limited w.e.f 01st June 2026 and canceled their Lease Agreement dated 12th February 2026.
Announcement under Regulation 30 (LODR)-Newspaper Publication
26-May-2026 | Source : BSENewspaper Advertisement of extract of Audited Financial Results for the quarter and year ended on 31st March 2026.
Re-Appointment Of Internal Auditor For F.Y 2026-2027
25-May-2026 | Source : BSERe-Appointment of Internal Auditor for F.Y 2026-2027
Corporate Actions

No Upcoming Board Meetings

No Dividend history available

No Splits history available

No Bonus history available

No Rights history available
Quality key factors
Valuation key factors
Technicals key factors
 Technical Indicator Scale: Bearish, Mildly Bearish, Sideways, Mildly Bullish, Bullish Turned
 Shareholding Snapshot : Mar 2026
Shareholding Compare (%holding)
Promoters
None
Held by 0 Schemes
Held by 2 FIIs (25.66%)
Maulin Bhavesh Acharya Huf (8.54%)
Polus Global Fund (15.7%)
11.45%
Quarterly Results Snapshot (Standalone) - Mar'26 - QoQ

QoQ Growth in quarter ended Mar 2026 is 18.30% vs 53.62% in Dec 2025
QoQ Growth in quarter ended Mar 2026 is 77.78% vs 523.08% in Dec 2025
Annual Results Snapshot (Standalone) - Mar'26

YoY Growth in year ended Mar 2026 is 124.41% vs 37.95% in Mar 2025
YoY Growth in year ended Mar 2026 is 163.30% vs 41.56% in Mar 2025


